You are here: Foswiki>Homepages Web>CreateHomepageTopic>HomepageGosiaSudol>GosiaSudolHomepageAnisotropy (2019-05-23, GosiaSudol)Edit Attach
Comparison of the anisotropy from exp with all models presented in paper has been done in addition.
Also please have a look into older HADES pion paper from CC. https://arxiv.org/pdf/0902.4377.pdf
You can see, that already in those old data similar trend of A2 as a function of p_cm was observed.
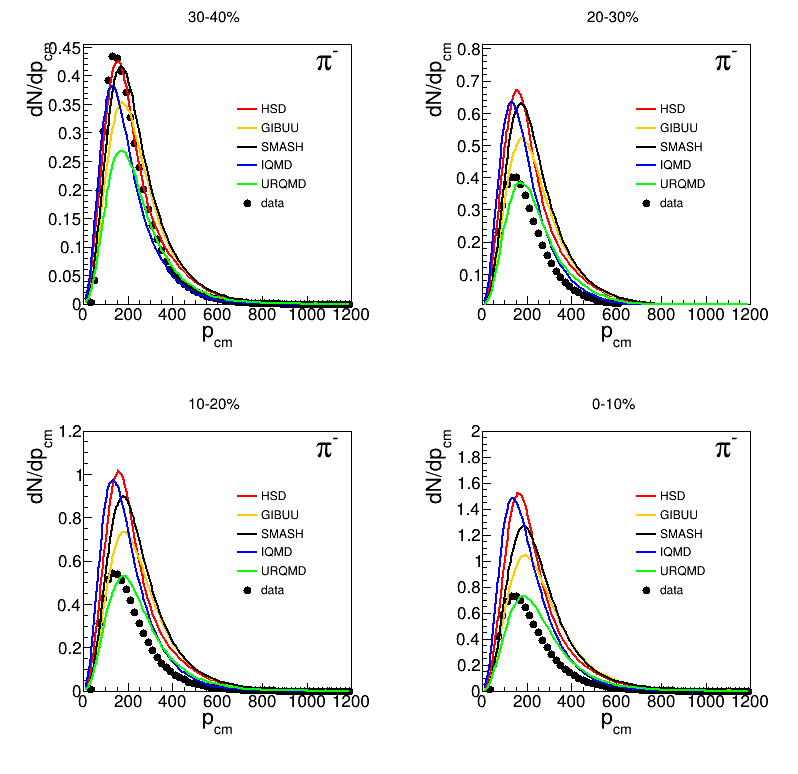
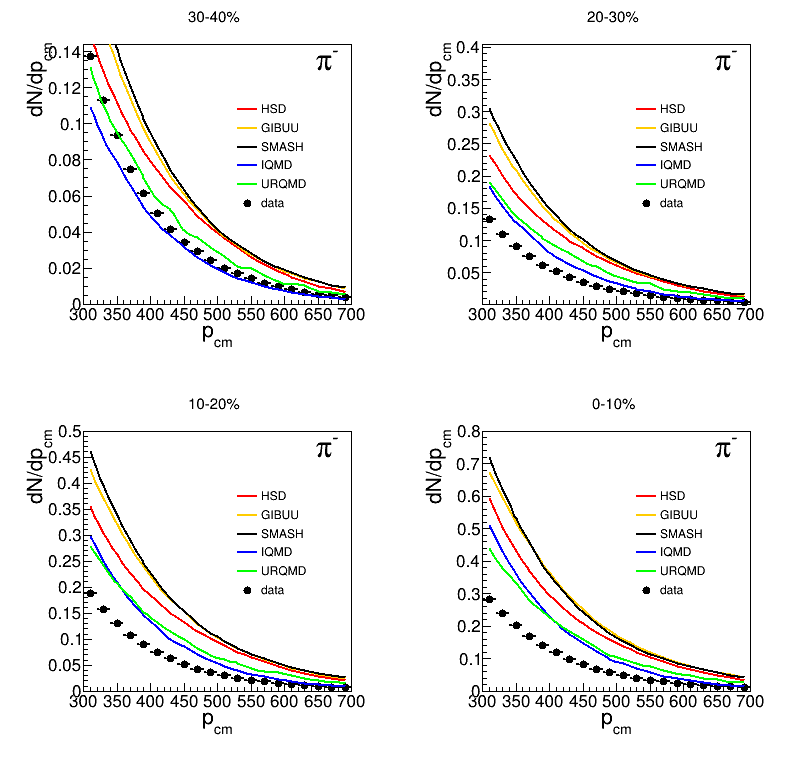
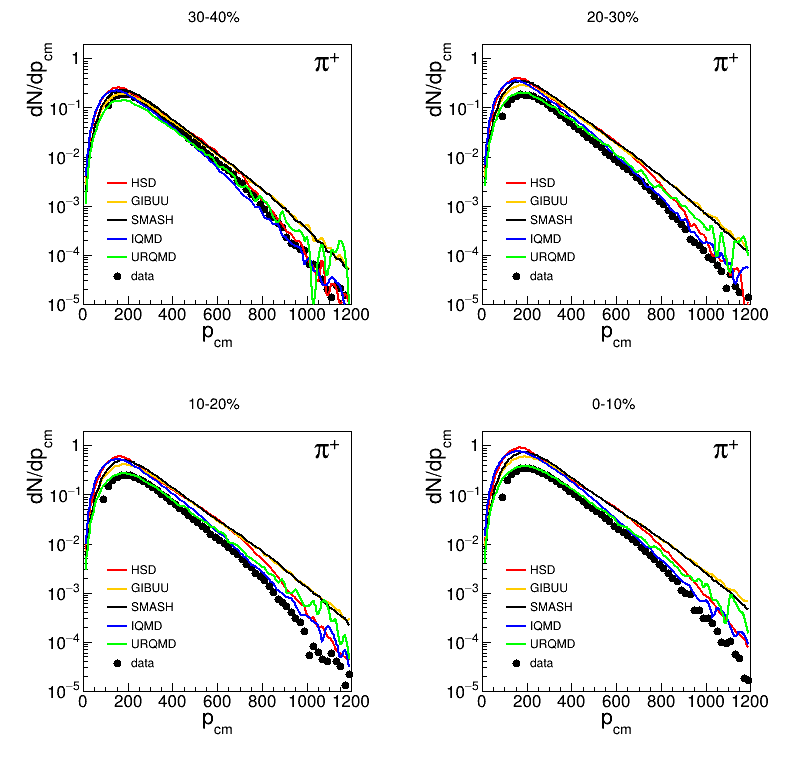
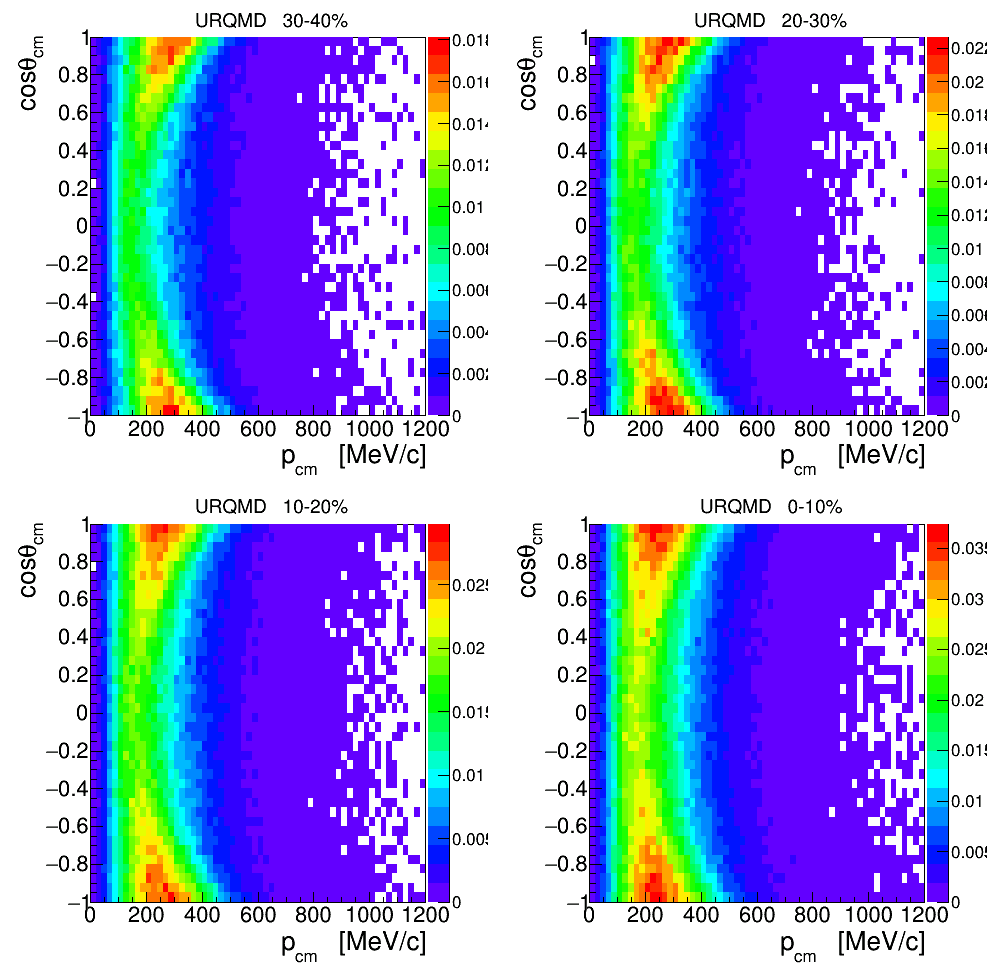
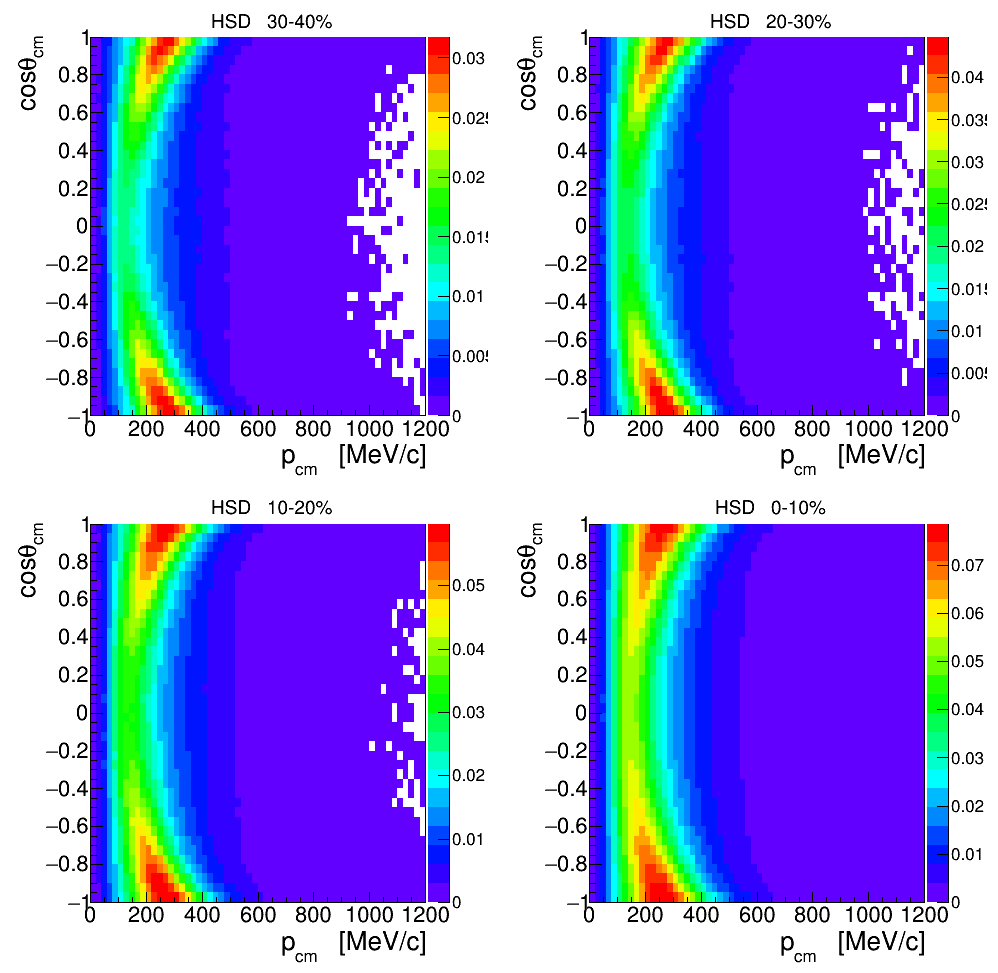
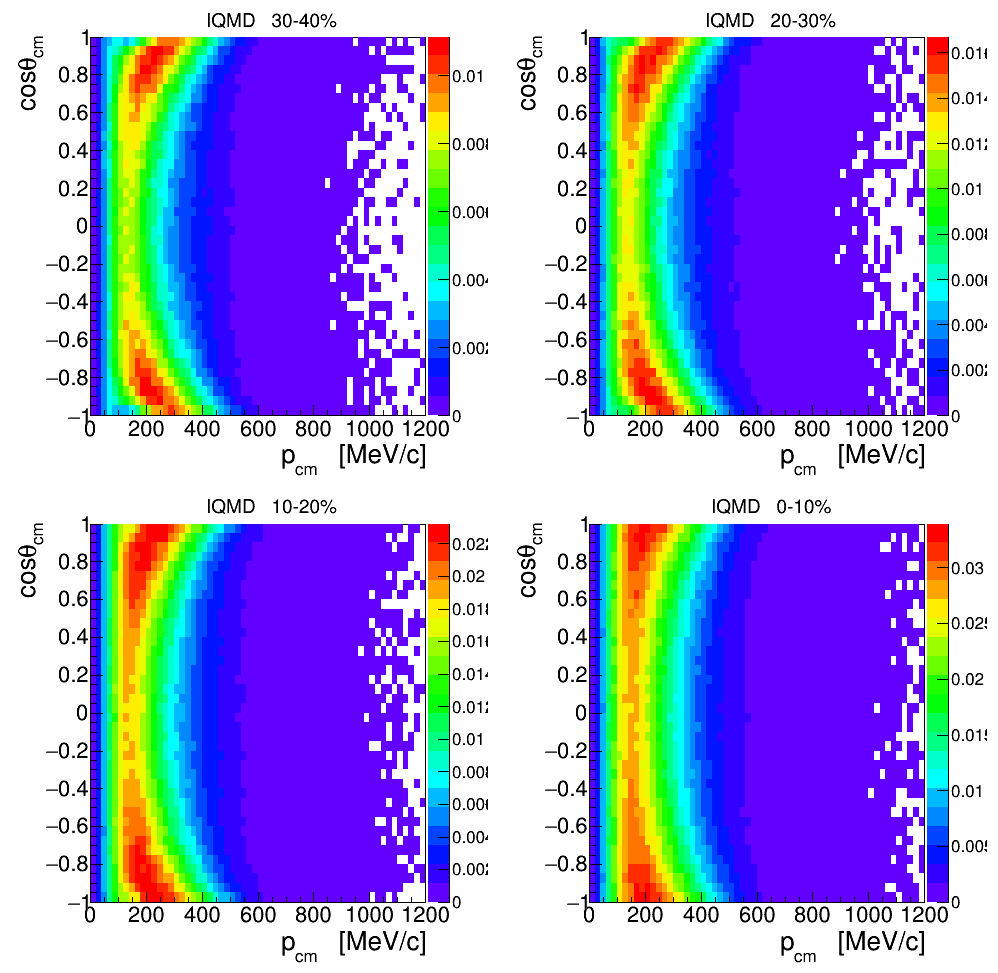
Plots below shows few spectra from models.
At the end what i would propouse for paper is as follows :

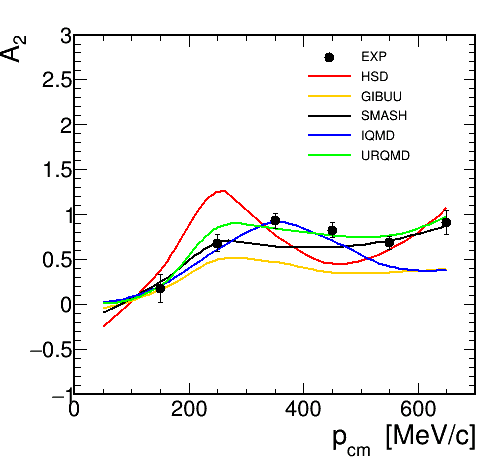
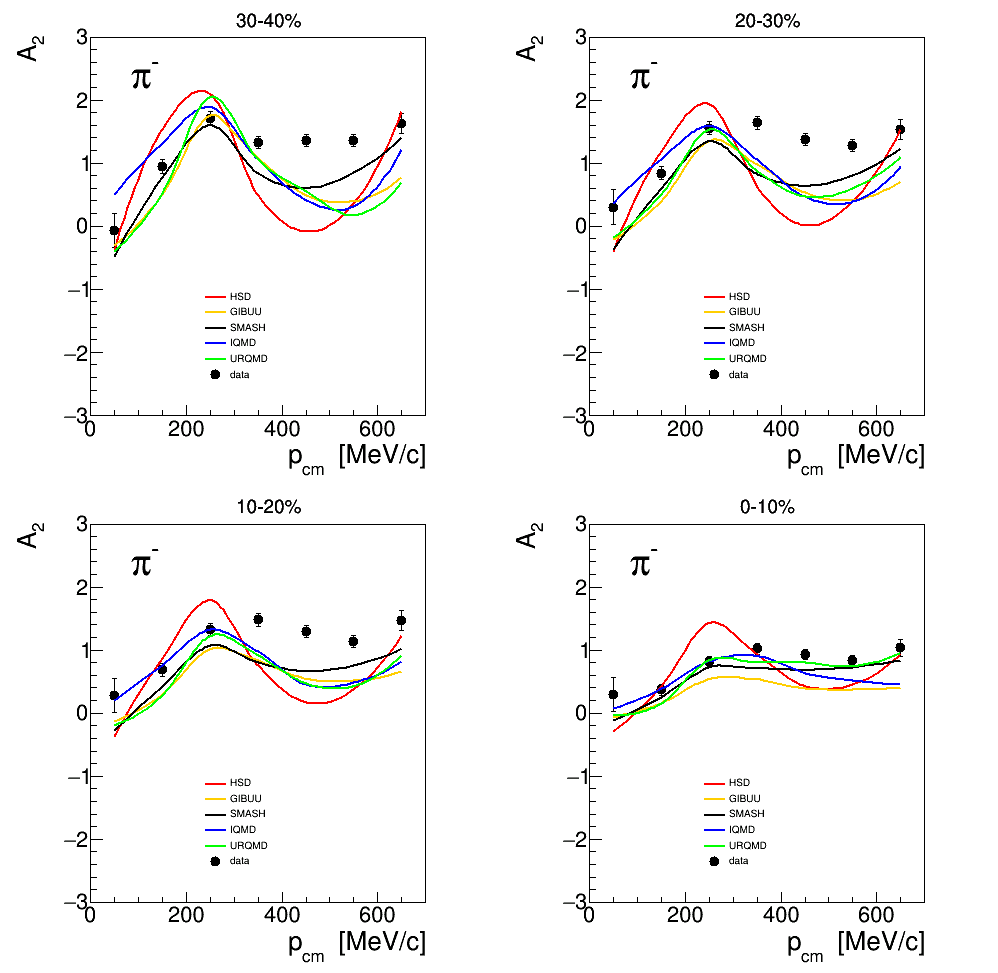
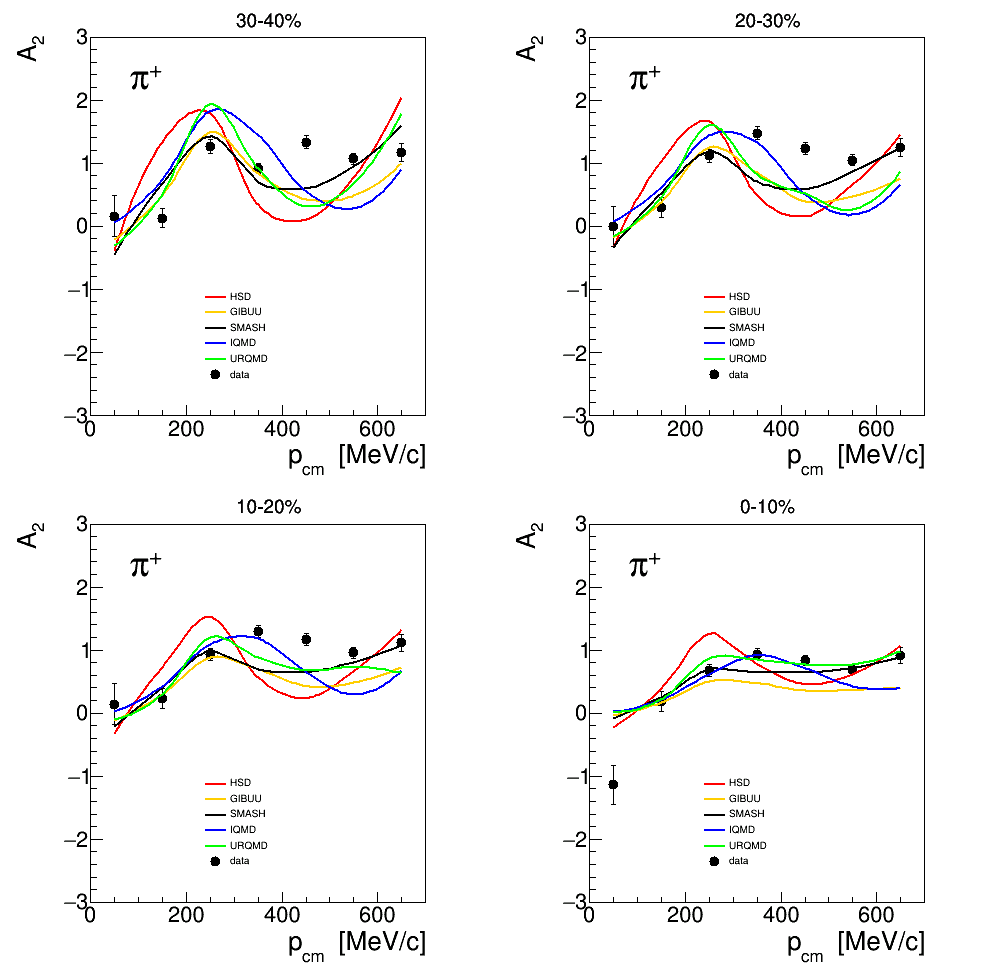
 anisotropy as a function of center of mass for 4 centrality classes and 5 models in comparison to models.
positive π

Additional plots for negative π from EXP


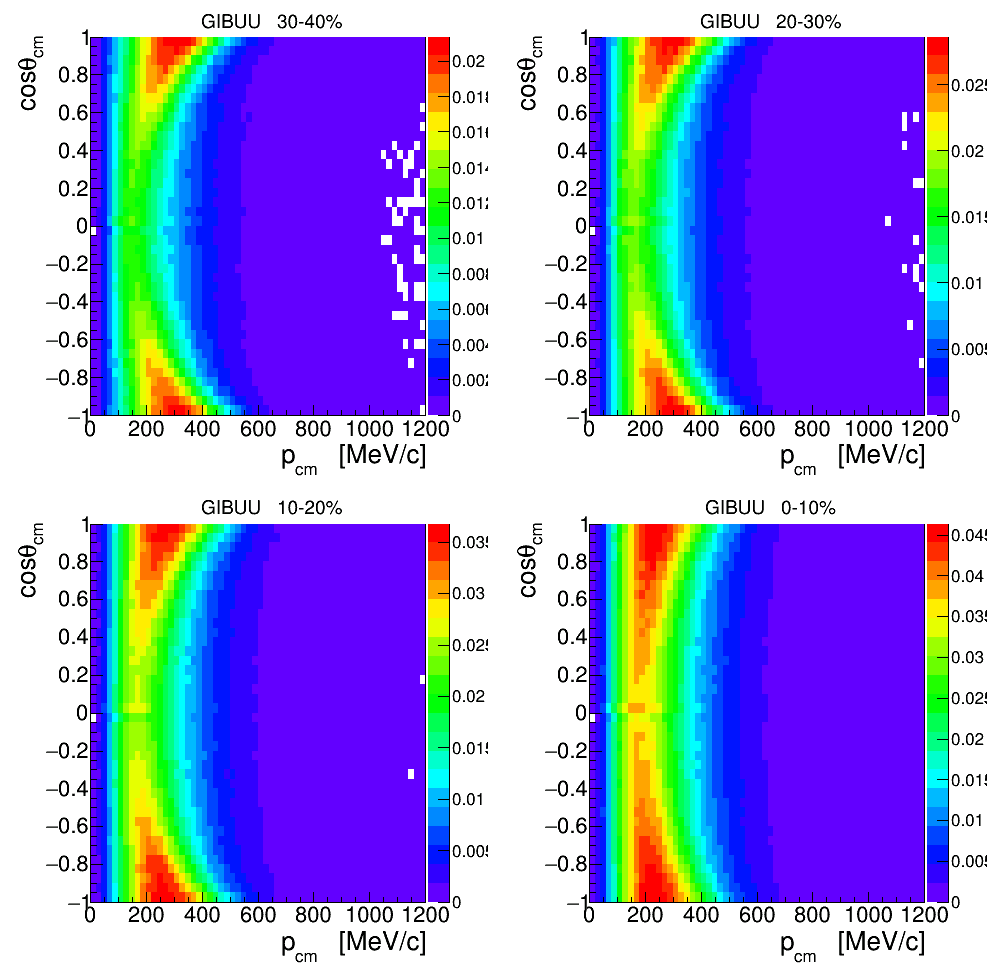
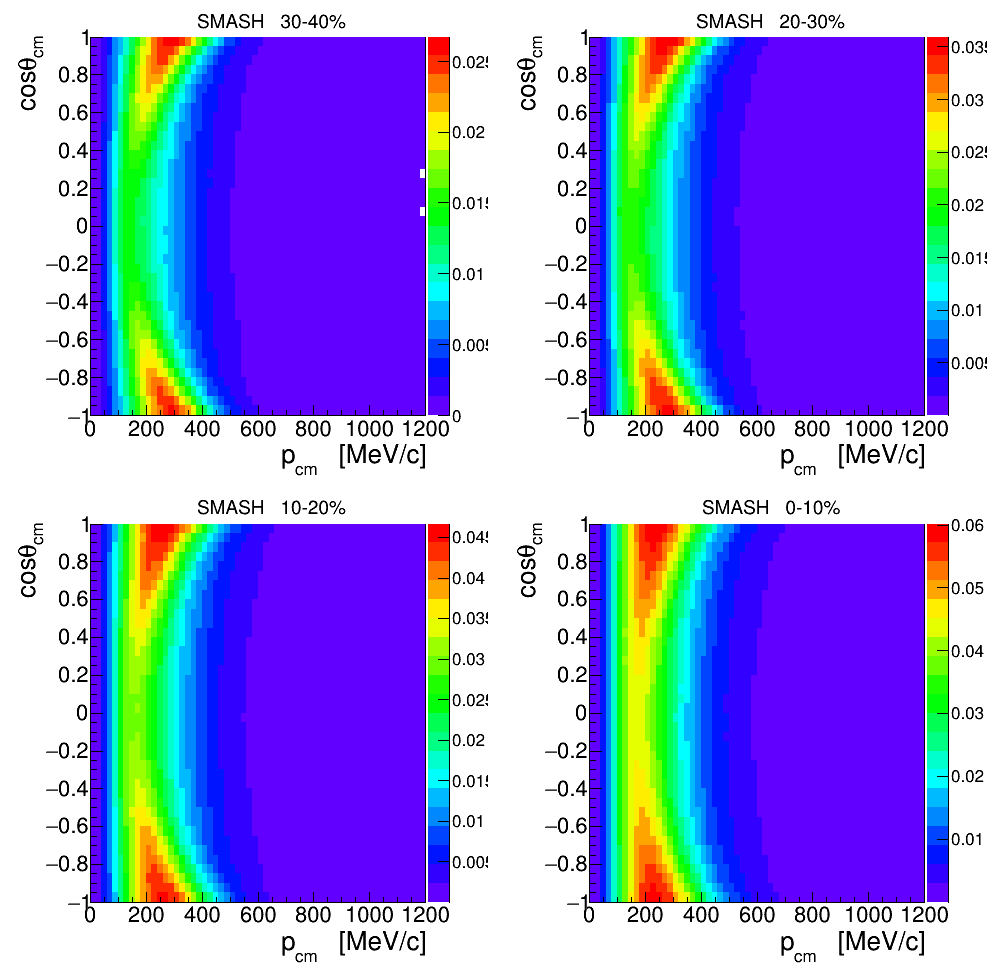
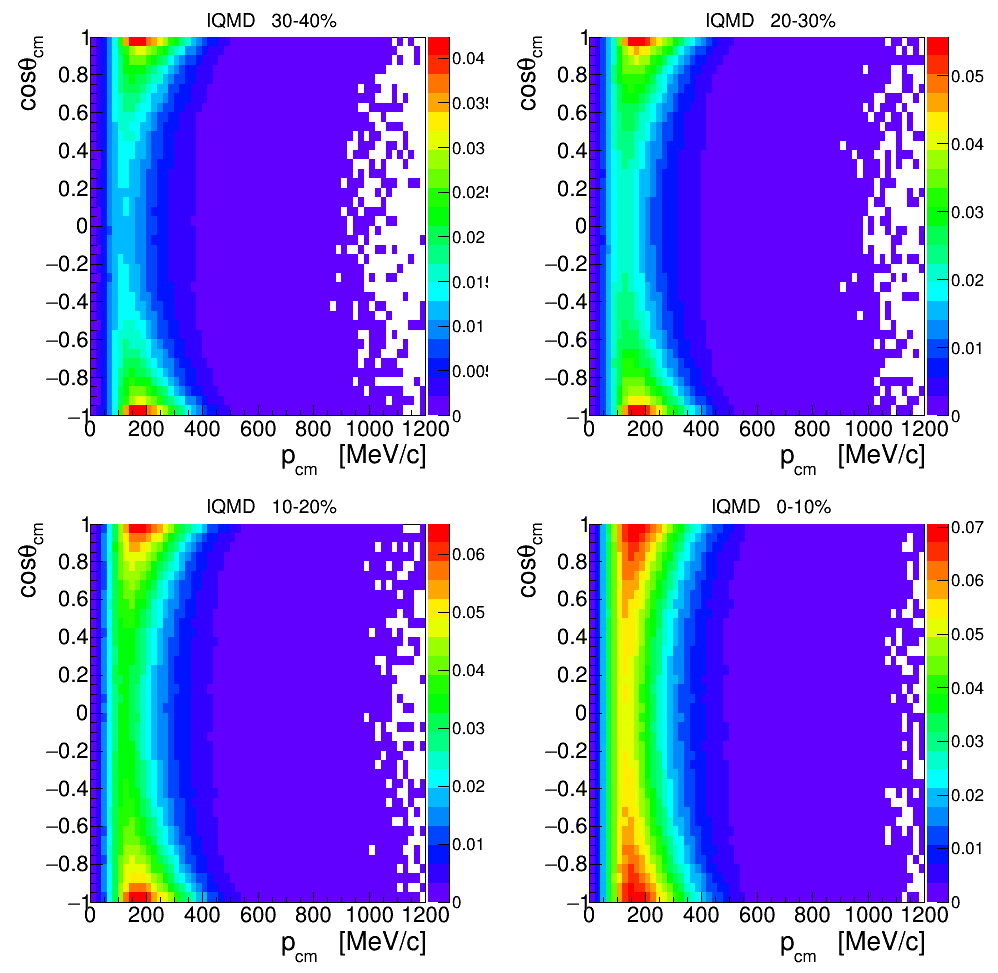
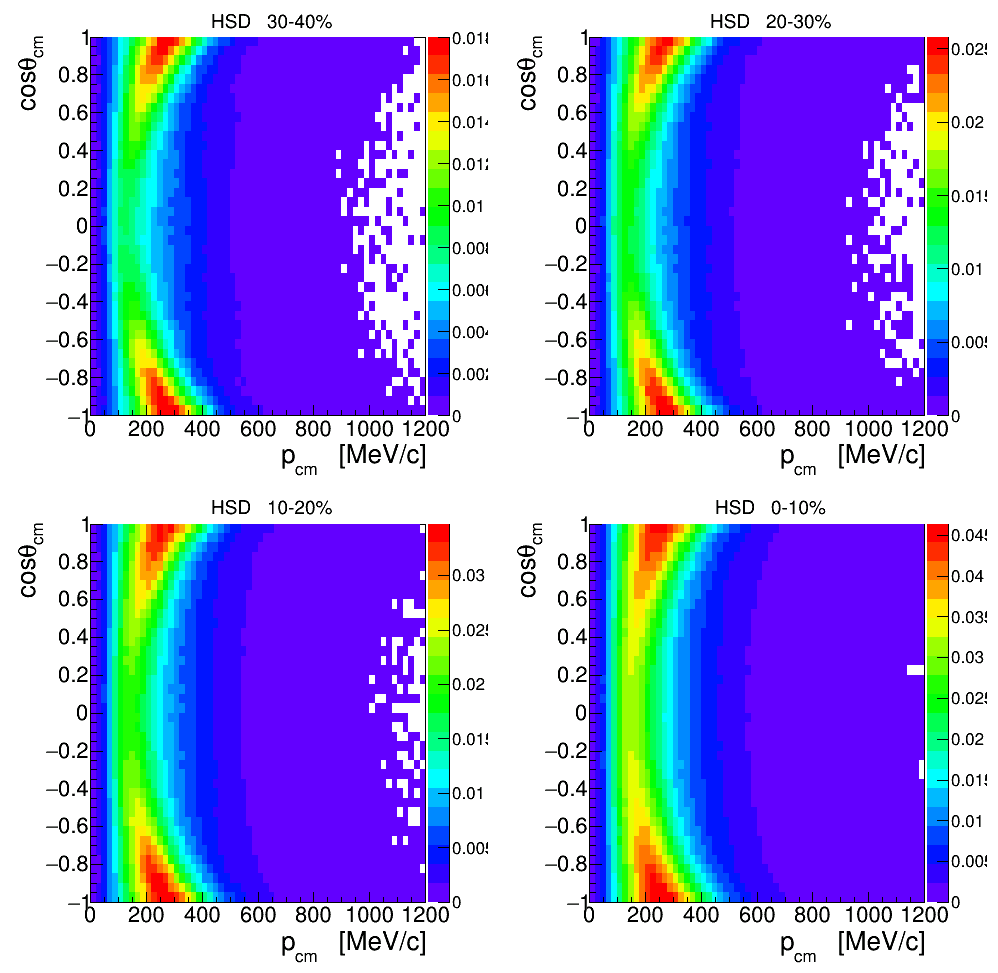
Also please have a look into older HADES pion paper from CC. https://arxiv.org/pdf/0902.4377.pdf
You can see, that already in those old data similar trend of A2 as a function of p_cm was observed.
Plots below shows few spectra from models.
At the end what i would propouse for paper is as follows : exchange Fig. 14 with following one
Centrality selection 0-10 % , left-handside : negative pions, right-handside : positive pions

on Fig. 13 instead of angular distribution from UrQMD show the fits, which are used to extract A2
exchange Fig. 15 with following
Below several additional plots can be found.
negative π
In the following plot all lines has been scaled at mid-rapidity in order to see comparison of the shape. anisotropy as a function of center of mass for 4 centrality classes and 5 models in comparison to models.

positive π


Additional plots for negative π from EXP


Even more additional plots for negative π


Even more additi
onal plots for positive π
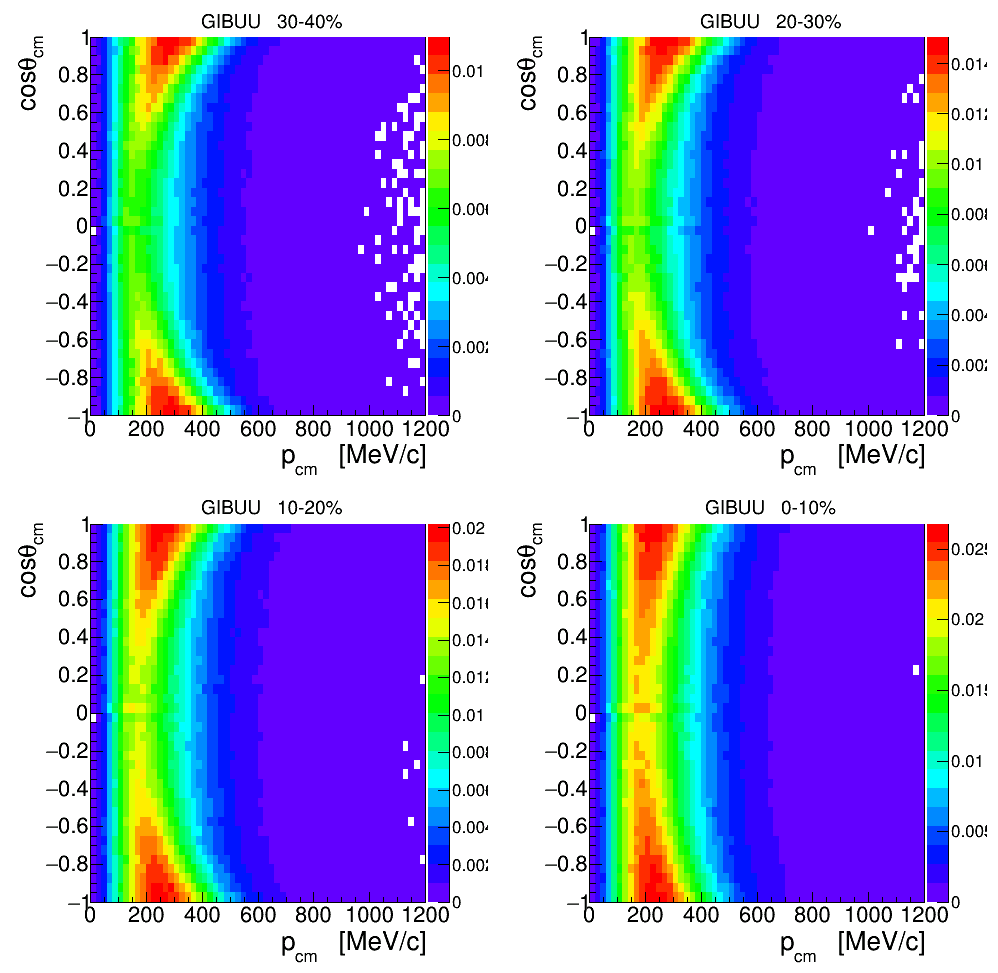
- pip_gibuu_cosP.gif:


Edit | Attach | Print version | History: r8 < r7 < r6 < r5 | Backlinks | View wiki text | Edit wiki text | More topic actions
Topic revision: r8 - 2019-05-23, GosiaSudol
Copyright © by the contributing authors. All material on this collaboration platform is the property of the contributing authors.
Ideas, requests, problems regarding Foswiki Send feedback | Imprint | Privacy Policy (in German)
Ideas, requests, problems regarding Foswiki Send feedback | Imprint | Privacy Policy (in German)

