You are here: Foswiki>Homepages Web>CreateHomepageTopic>HomepageGosiaSudol>HowmepageGosiaSudolExtrapoltionInPt>HowmepageGosiaSudolExtrapoltionInPt_negative (2019-08-13, GosiaSudol)Edit Attach
Example of negative pion purity for 0-10% centrality bin
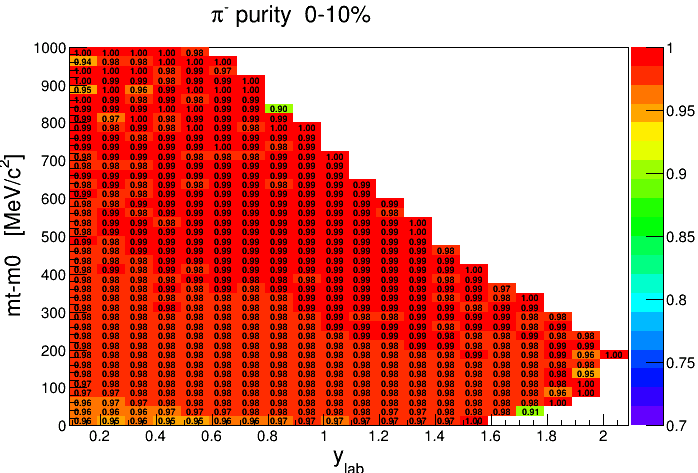
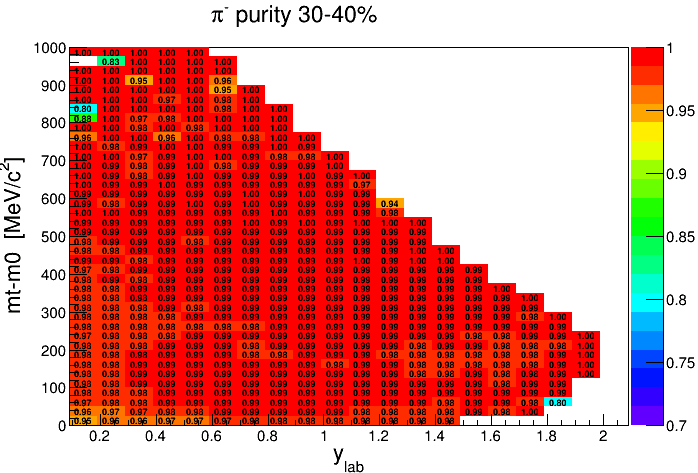
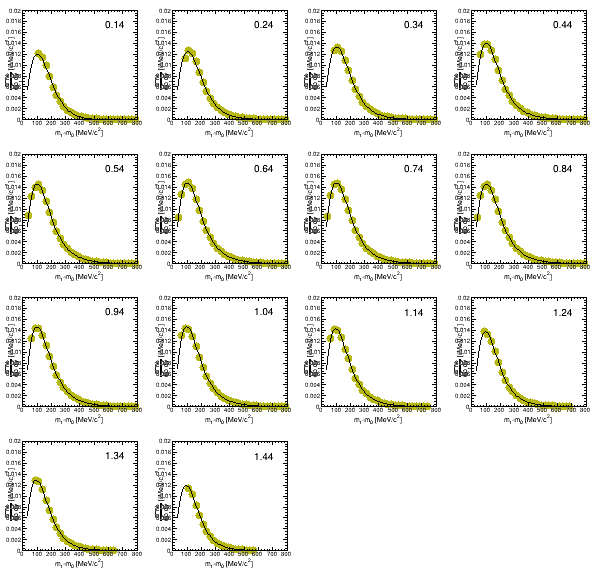
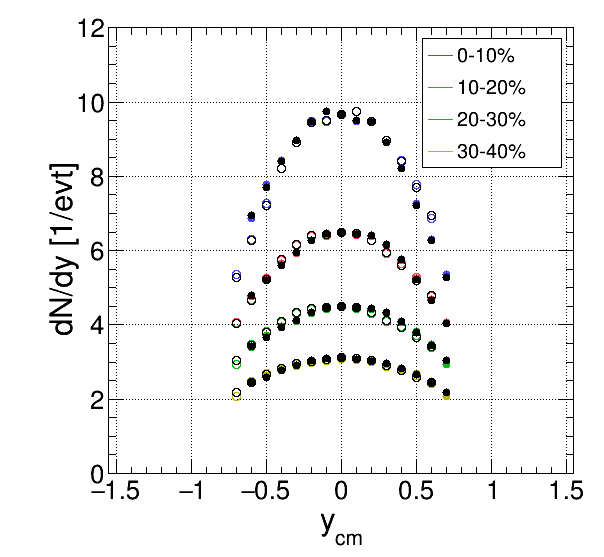
Below you can find details of extrapolation of positively charged pion yield using pt.
Table below shows following informations :middle of the y-bin , centrality bin, experimental yield, extrapolated 4pi yield, % of extrapolatio
0.14   0   1.61509     2.38967    32.4134
0.24   0   2.08642     2.57871    19.0907
0.34   0   2.23582     2.77113    19.3174
0.44   0   2.61853     2.89542    9.56299
0.54   0   2.95482     3.03095    2.5117
0.64   0   3.02291     3.09931    2.46494
0.74   0   3.04009     3.11622    2.4432
0.84   0   2.98559     3.06093    2.46138
0.94   0   2.71066     3.00247    9.71899
1.04   0   2.65704     2.95471    10.0744
1.14   0   2.5466      2.83844    10.282
1.24   0   2.07445     2.65655    21.9119
1.34   0   1.88142     2.43795    22.8277
1.44   0   1.35926     2.1722     37.4245


0.14  1    2.27029      3.43105   33.8312
0.24  1    2.95808      3.65296   19.0224
0.34  1    3.16601      3.92138   19.263
0.44  1    3.72077      4.11666   9.61665
0.54  1    4.21323      4.32301   2.53947
0.64  1    4.34569      4.45682   2.49349
0.74  1    4.3906       4.5043    2.52414
0.84  1    4.34771      4.46218   2.56546
0.94  1    4.01249      4.44546   9.73956
1.04  1    3.90755      4.33395   9.83852
1.14  1    3.68778      4.09611   9.96878
1.24  1    2.98774      3.7841    21.045
1.34  1    2.67755      3.43369   22.0213
1.44  1    1.92856      3.03654   36.4883


0.14  2     3.24123     4.79996    32.4738
0.24  2     4.24634     5.20868    18.4758
0.34  2     4.55051     5.59822    18.7151
0.44  2     5.37994     5.94513    9.50673
0.54  2     6.12241     6.28102    2.52533
0.64  2     6.3013      6.46059    2.4655
0.74  2     6.33907     6.5022     2.50885
0.84  2     6.26955     6.43424    2.55966
0.94  2     5.80383     6.4055     9.393
1.04  2     5.58354     6.1623     9.39195
1.14  2     5.21717     5.76636    9.52396
1.24  2     4.16798     5.21488    20.0753
1.34  2     3.68101     4.65833    20.9801
1.44  2     2.63902     4.04113    34.6961


0.14  3    4.83772      6.93497    30.2416
0.24  3    6.38068      7.69298    17.0585
0.34  3    6.92888      8.395      17.4642
0.44  3    8.16362      8.95837    8.87164
0.54  3    9.25837      9.48259    2.36459
0.64  3    9.51102      9.73479    2.29873
0.74  3    9.44478      9.67221    2.3514
0.84  3    9.27487      9.50649    2.43651
0.94  3    8.62647      9.45072    8.72146
1.04  3    8.13456      8.91534    8.7578
1.14  3    7.48634      8.2219     8.94635
1.24  3    5.88123      7.221      18.5538
1.34  3    5.04286      6.27454    19.6298
1.44  3    3.586        5.27988    32.0819

 meaning of centrality bins :
0 : 30-40%
1 : 20-30%
2 : 10-20%
3 :  0-10%
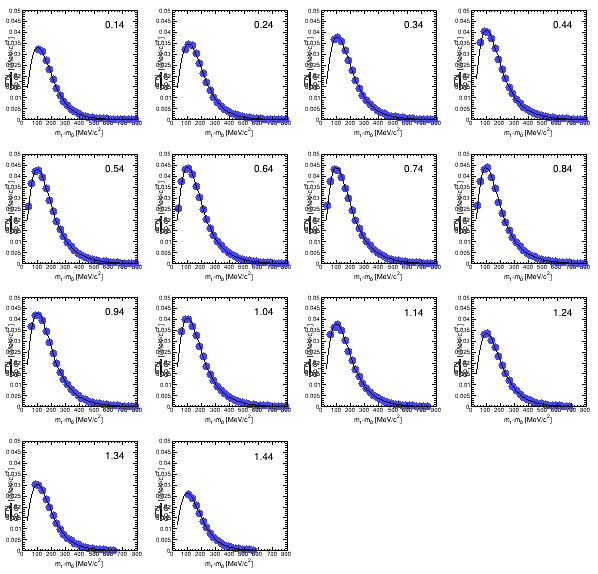
- pim_ptFits_0_10.gif:
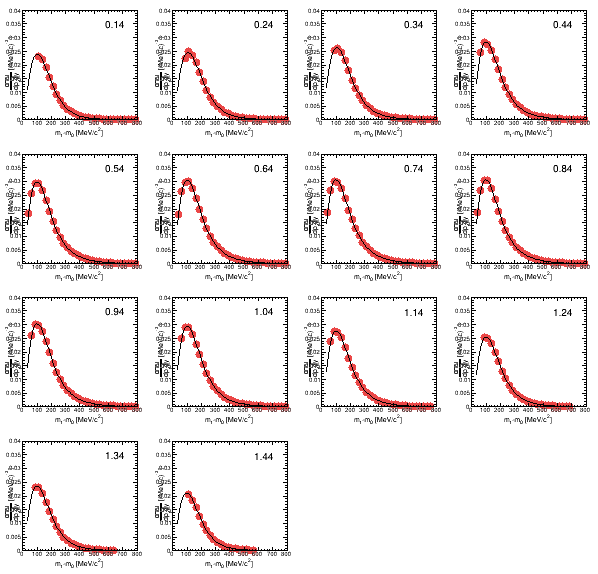
- pim_ptFits_10_20.gif:
- pim_ptFits_20_30.gif:
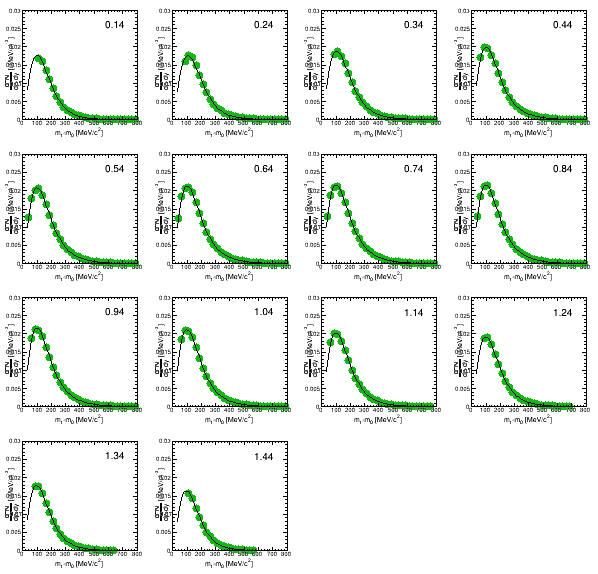
- pim_ptFits_30_40.gif:
| I | Attachment | Action | Size | Date | Who | Comment |
|---|---|---|---|---|---|---|
| |
pim_dNdY_mtExt_PtExt.gif | manage | 9 K | 2019-08-13 - 11:42 | GosiaSudol | |
| |
pim_ptFits_0_10.gif | manage | 24 K | 2019-08-13 - 11:48 | GosiaSudol | |
| |
pim_ptFits_10_20.gif | manage | 23 K | 2019-08-13 - 11:49 | GosiaSudol | |
| |
pim_ptFits_20_30.gif | manage | 22 K | 2019-08-13 - 11:49 | GosiaSudol | |
| |
pim_ptFits_30_40.gif | manage | 24 K | 2019-08-13 - 11:48 | GosiaSudol | |
| |
pim_purity_0_10.gif | manage | 32 K | 2019-07-31 - 00:16 | GosiaSudol | |
| |
pim_purity_30_40.gif | manage | 31 K | 2019-07-31 - 00:17 | GosiaSudol |
Edit | Attach | Print version | History: r2 < r1 | Backlinks | View wiki text | Edit wiki text | More topic actions
Topic revision: r2 - 2019-08-13, GosiaSudol
Copyright © by the contributing authors. All material on this collaboration platform is the property of the contributing authors.
Ideas, requests, problems regarding Foswiki Send feedback | Imprint | Privacy Policy (in German)
Ideas, requests, problems regarding Foswiki Send feedback | Imprint | Privacy Policy (in German)


