You are here: Foswiki>Homepages Web>CreateHomepageTopic>HomepagePavelTlusty>CCMtfits-comparisonToTAPS (2008-12-05, PavelTlusty)Edit Attach
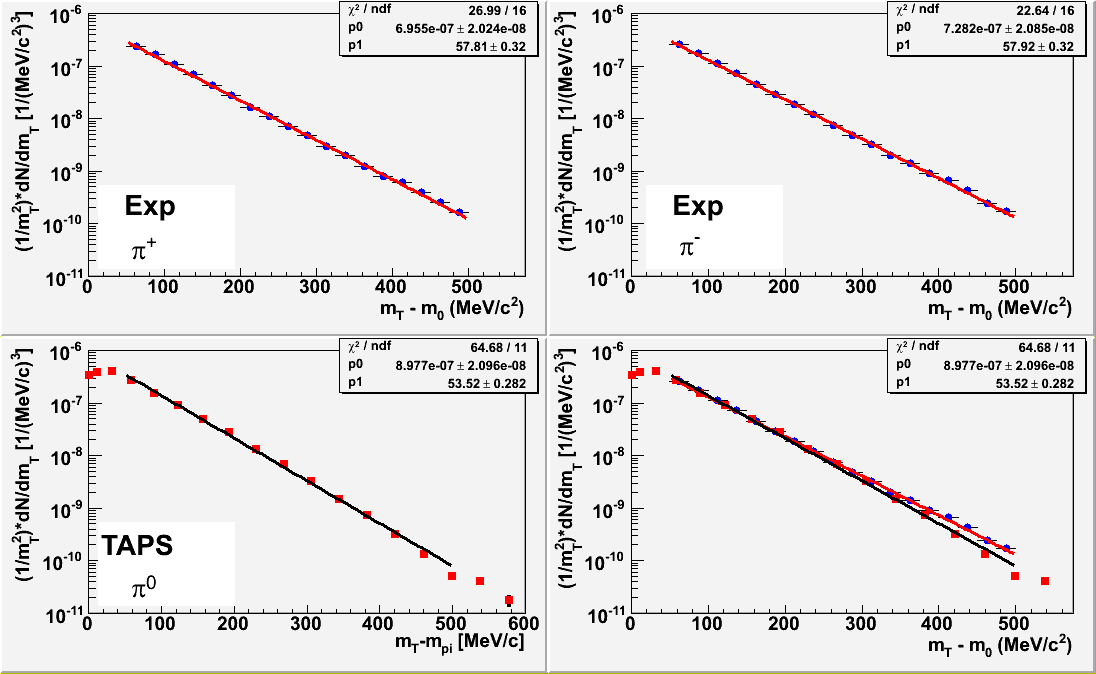
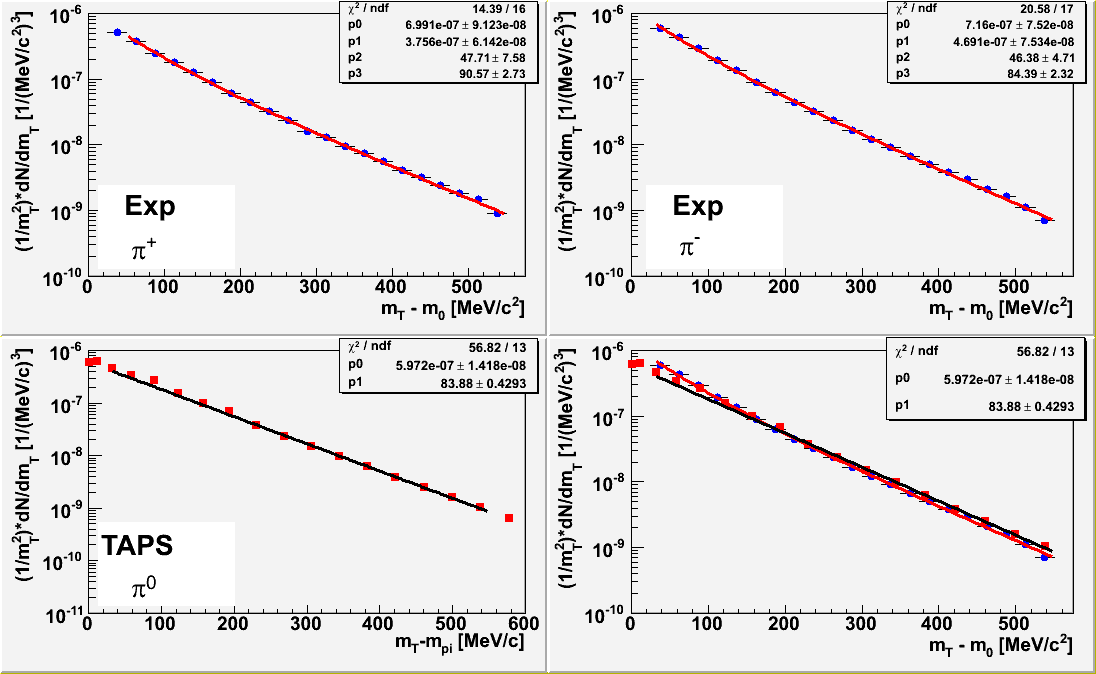
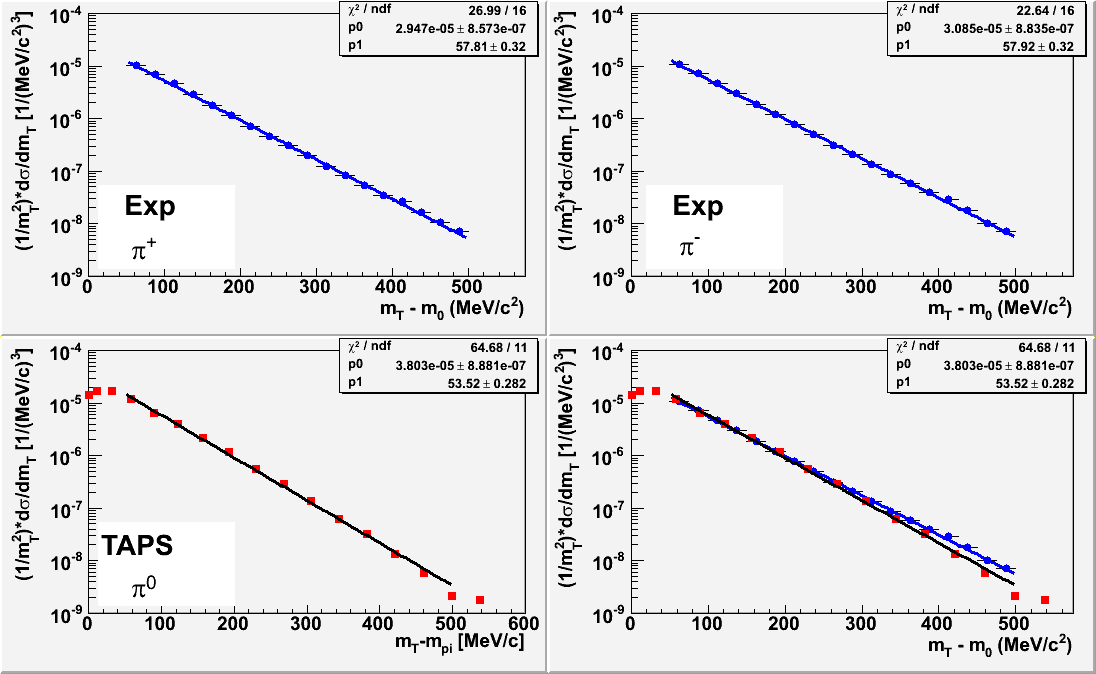
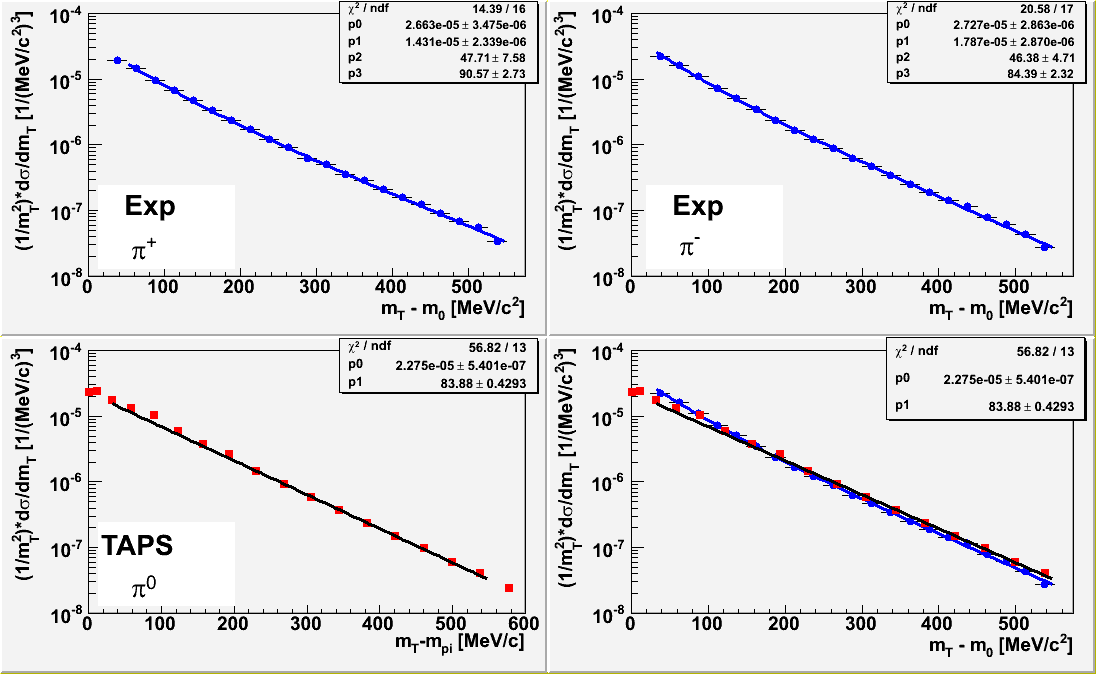
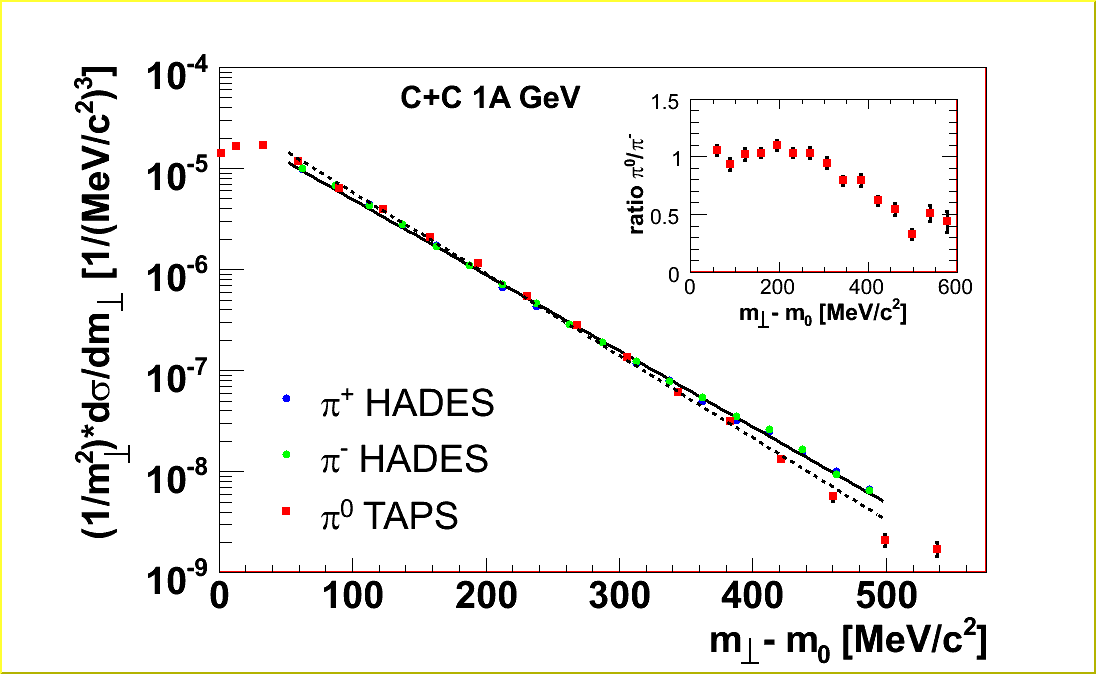
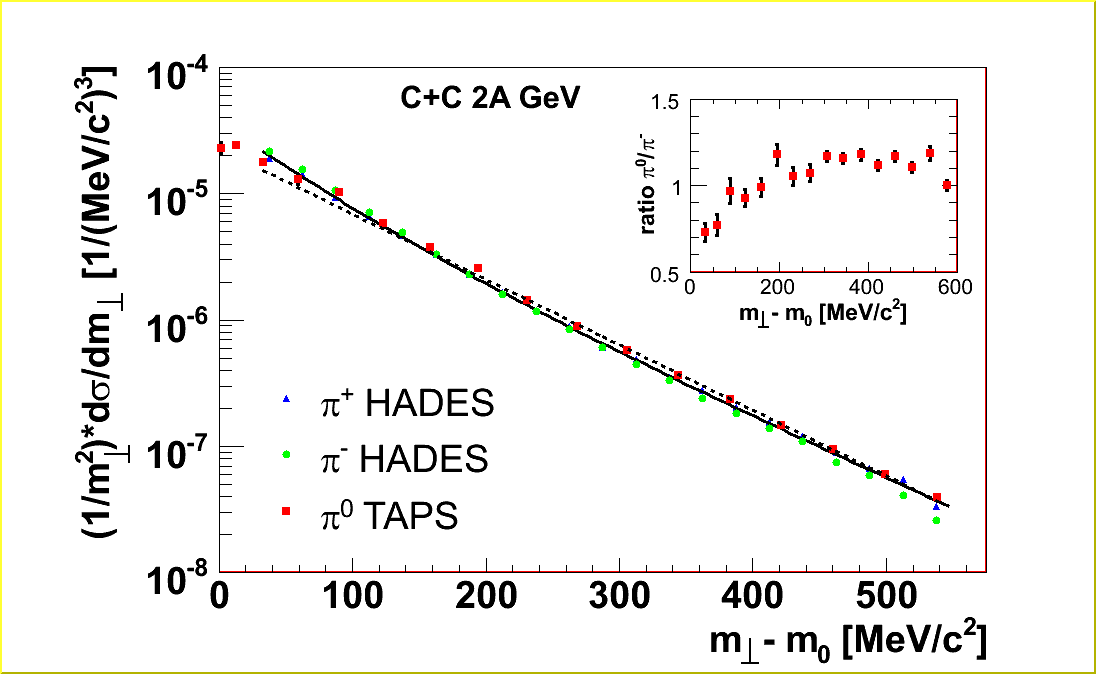
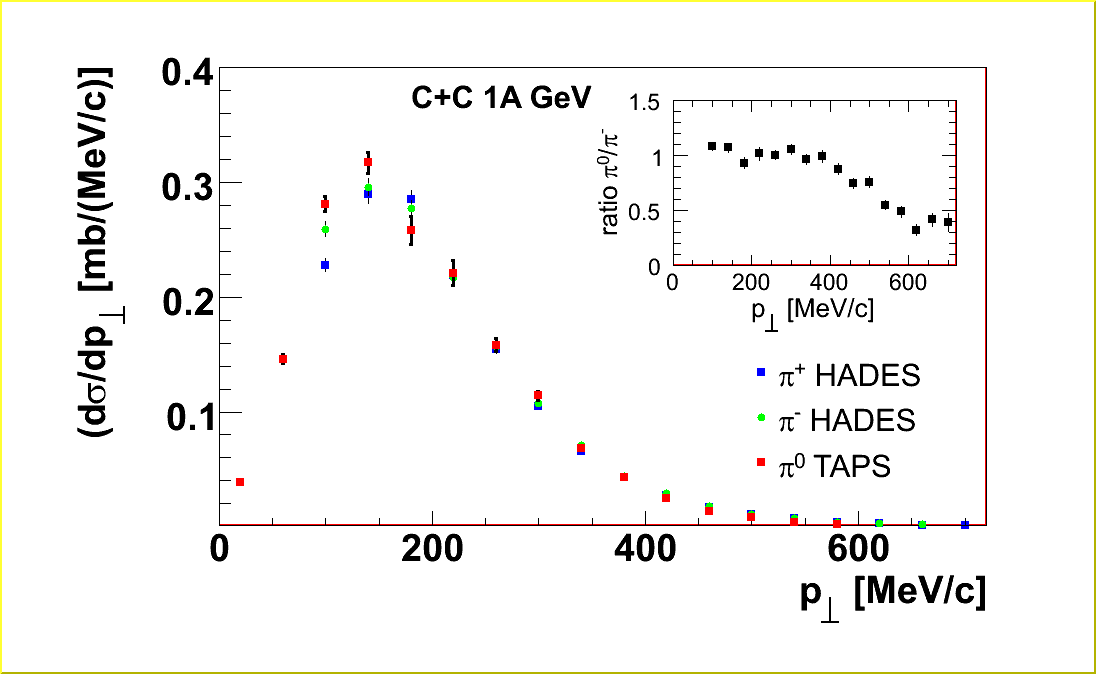
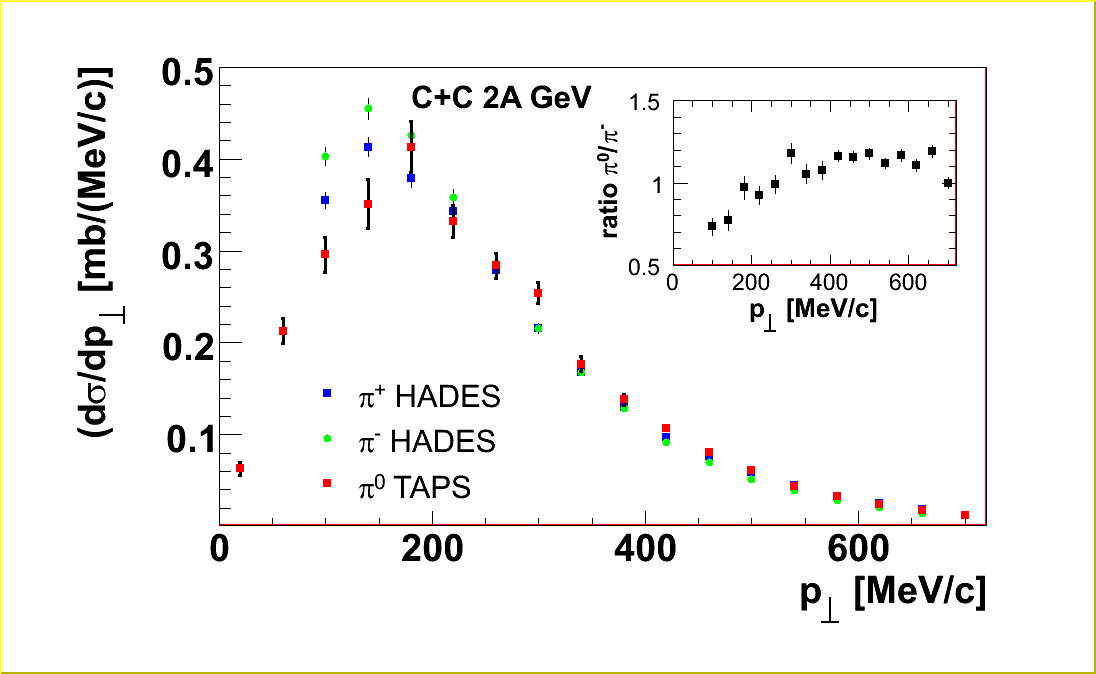
m_t plots for pi+ and pi- from C+C at 1 and 2A GeV are compared to pi0 from TAPS.
TAPS data points are from R. Averbeck (published in R. Averbeck Z. Phys. A359 (1997) 65, Fig.5), and show 1/(m_t*m_t)*d(sigma)/dm_t at midrapidity (rapidity windows are 0.42-0.74 and 0.80-1.08 for 1 and 2 GeV, respectively). Then the TAPS points are re-calculated to the 1(m_t*m_t)*dN/dm_t assuming total cross section 950 mb, and corrected to minimum bias by a ratio of number of participants 8.61/6. and 8.38/6. 1 and 2 GeV, respectively.
2 figures show the comparison for 1 and 2 GeV in 4 plots: a) HADES pi+ b)HADES pi- c) TAPS pi0 d) HADES pi- and TAPS pi0.
Note that the fit of the TAPS data shows the same (small) slope error (~0.3 MeV) as fits of our data by 1 slope. The errors are almost same for fits in the same range as HADES data and in the range shown in the Fig.5 of the TAPS paper. Errors published by TAPS are larger: 3 and 2 MeV for 1 and 2 GeV data.
-- PavelTlusty - 11 Nov 2008
1 GeV 2 GeV
TAPS pi0 68+-5 117+-15
HADES pi+ 60.1 115
HADES pi- 62.4 122
TAPS data points are from R. Averbeck (published in R. Averbeck Z. Phys. A359 (1997) 65, Fig.5), and show 1/(m_t*m_t)*d(sigma)/dm_t at midrapidity (rapidity windows are 0.42-0.74 and 0.80-1.08 for 1 and 2 GeV, respectively). Then the TAPS points are re-calculated to the 1(m_t*m_t)*dN/dm_t assuming total cross section 950 mb, and corrected to minimum bias by a ratio of number of participants 8.61/6. and 8.38/6. 1 and 2 GeV, respectively.
2 figures show the comparison for 1 and 2 GeV in 4 plots: a) HADES pi+ b)HADES pi- c) TAPS pi0 d) HADES pi- and TAPS pi0.
Note that the fit of the TAPS data shows the same (small) slope error (~0.3 MeV) as fits of our data by 1 slope. The errors are almost same for fits in the same range as HADES data and in the range shown in the Fig.5 of the TAPS paper. Errors published by TAPS are larger: 3 and 2 MeV for 1 and 2 GeV data.
- c1c:
- c2c:
-- PavelTlusty - 11 Nov 2008
- c1c:
- c2c:
1 GeV 2 GeV
TAPS pi0 68+-5 117+-15
HADES pi+ 60.1 115
HADES pi- 62.4 122
- c1c m_t:
- c2c m_t:
- c1c p_t:
- c2c p_t:
| I | Attachment | Action | Size | Date | Who | Comment |
|---|---|---|---|---|---|---|
| |
c1c_pt_hades_taps_liny.gif | manage | 16 K | 2008-12-05 - 14:10 | PavelTlusty | c1c p_t |
| |
c2c_pt_hades_taps_liny.gif | manage | 17 K | 2008-12-05 - 14:10 | PavelTlusty | c2c p_t |
| |
mt_pi_c1c_hades_taps.gif | manage | 29 K | 2008-11-11 - 09:19 | PavelTlusty | c1c |
| |
mt_pi_c1c_hades_taps_inset.gif | manage | 19 K | 2008-12-05 - 11:27 | PavelTlusty | c1c m_t |
| |
mt_pi_c1c_hades_taps_normtaps.gif | manage | 28 K | 2008-11-13 - 11:49 | PavelTlusty | c1c |
| |
mt_pi_c2c_hades_taps.gif | manage | 30 K | 2008-11-11 - 09:20 | PavelTlusty | c2c |
| |
mt_pi_c2c_hades_taps_inset.gif | manage | 19 K | 2008-12-05 - 11:28 | PavelTlusty | c2c m_t |
| |
mt_pi_c2c_hades_taps_normtaps.gif | manage | 29 K | 2008-11-13 - 11:50 | PavelTlusty | c2c |
Edit | Attach | Print version | History: r5 < r4 < r3 < r2 | Backlinks | View wiki text | Edit wiki text | More topic actions
Topic revision: r5 - 2008-12-05, PavelTlusty
Copyright © by the contributing authors. All material on this collaboration platform is the property of the contributing authors.
Ideas, requests, problems regarding Foswiki Send feedback | Imprint | Privacy Policy (in German)
Ideas, requests, problems regarding Foswiki Send feedback | Imprint | Privacy Policy (in German)


