You are here: Foswiki>Homepages Web>CreateHomepageTopic>HomepageGosiaSudol>HowmepageGosiaSudolModelComparison (2019-05-27, GosiaSudol)Edit Attach
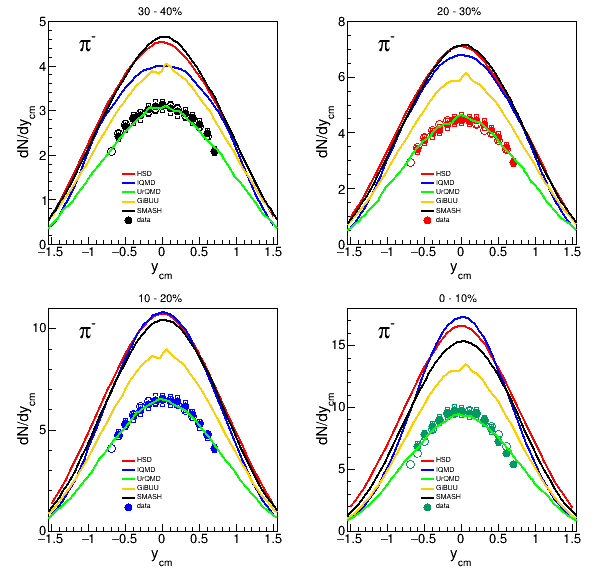
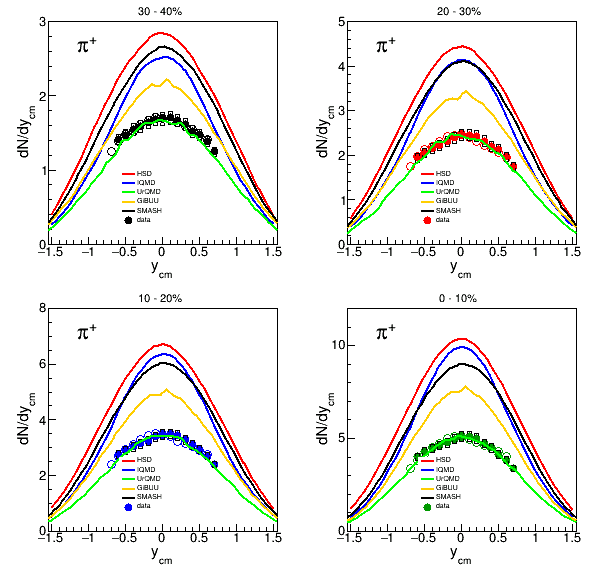
In the following you can find comparison of our data with 5 models within 10% centrality classes.
For transverse-mass spectra comparison is done for mid-rapidity (-0.05 < ycm < 0.05) as it is stated in paper.
All plots are absolutely normalized (also rapidity spectra).
Please ignore at the moment spike in case of GiBUU i will have a look what is a problem there.
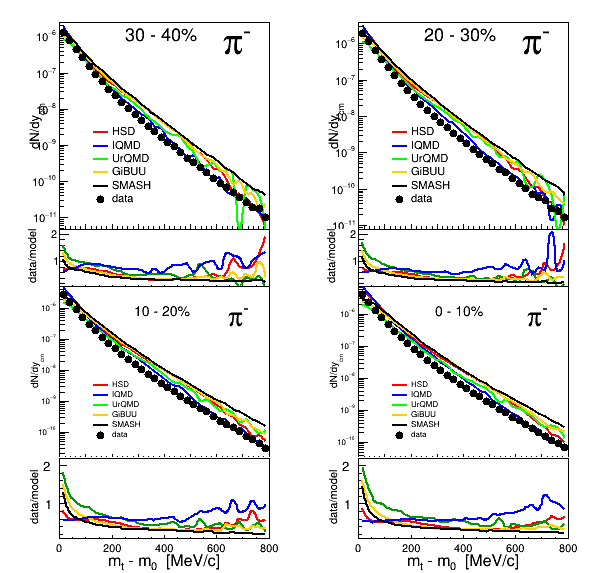
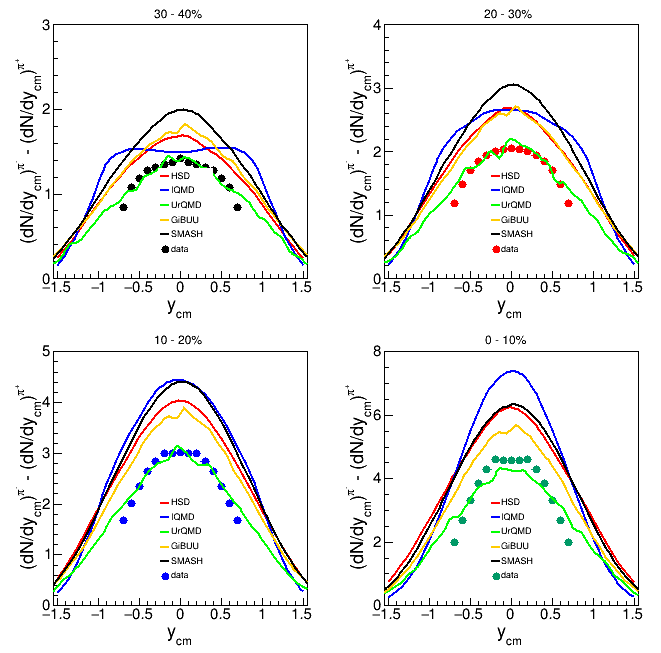
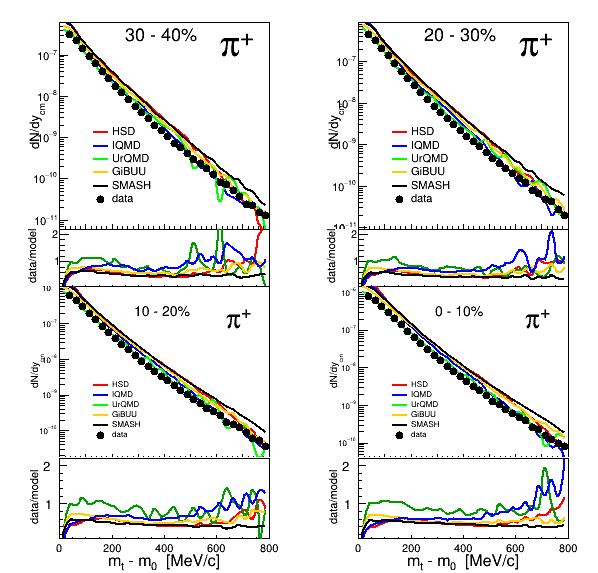 Figure below shows difference of rapidity pi- - pi+. In case of the experiment in order to do not have some not necesery structures which are our systematic i have made average from measured points and mirrored one.
For transverse-mass spectra comparison is done for mid-rapidity (-0.05 < ycm < 0.05) as it is stated in paper.
All plots are absolutely normalized (also rapidity spectra).
Please ignore at the moment spike in case of GiBUU i will have a look what is a problem there.

 Figure below shows difference of rapidity pi- - pi+. In case of the experiment in order to do not have some not necesery structures which are our systematic i have made average from measured points and mirrored one.
 | I | Attachment | Action | Size | Date | Who | Comment |
|---|---|---|---|---|---|---|
| |
Diff_dndyPiM_dndyPiP.gif | manage | 21 K | 2019-05-27 - 09:46 | GosiaSudol | |
| |
dNdy_pim_4Cent.gif | manage | 35 K | 2019-05-13 - 13:49 | GosiaSudol | |
| |
diffY_data_models.gif | manage | 18 K | 2019-05-15 - 22:51 | GosiaSudol | |
| |
pim_dNdY_models_4Cents.gif | manage | 18 K | 2019-05-13 - 21:05 | GosiaSudol | |
| |
pim_midY_mt.gif | manage | 19 K | 2019-05-15 - 21:57 | GosiaSudol | |
| |
pip_dNdY_models_4Cents.gif | manage | 18 K | 2019-05-13 - 21:05 | GosiaSudol | |
| |
pip_midY_mt.gif | manage | 19 K | 2019-05-15 - 21:57 | GosiaSudol |
Edit | Attach | Print version | History: r5 < r4 < r3 < r2 | Backlinks | View wiki text | Edit wiki text | More topic actions
Topic revision: r5 - 2019-05-27, GosiaSudol
Copyright © by the contributing authors. All material on this collaboration platform is the property of the contributing authors.
Ideas, requests, problems regarding Foswiki Send feedback | Imprint | Privacy Policy (in German)
Ideas, requests, problems regarding Foswiki Send feedback | Imprint | Privacy Policy (in German)

