You are here: Foswiki>Sandbox Web>SzymonsSandbox (2016-02-29, SzymonHarabasz)Edit Attach
Szymon's Personal Page
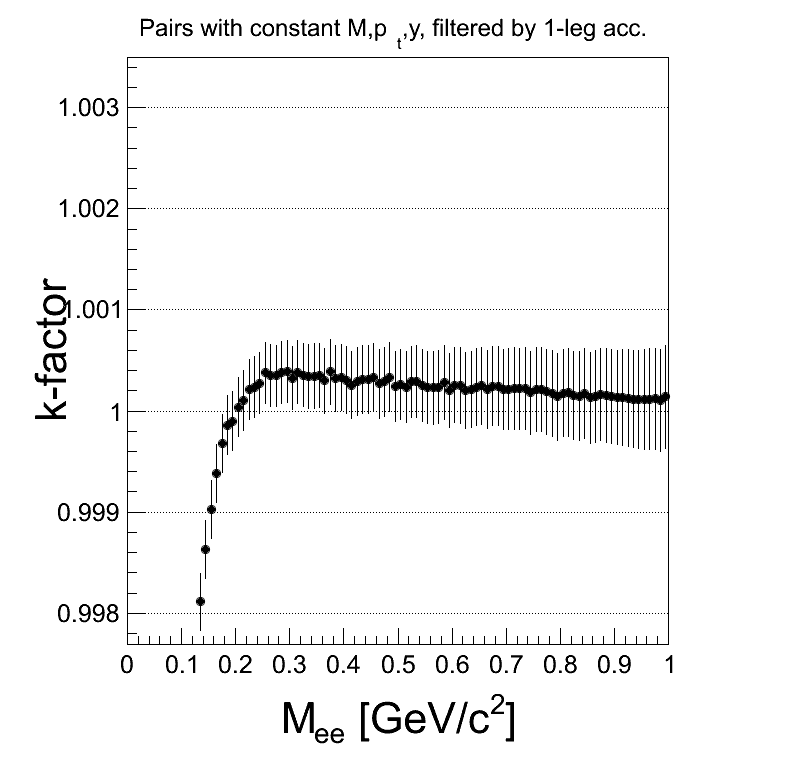
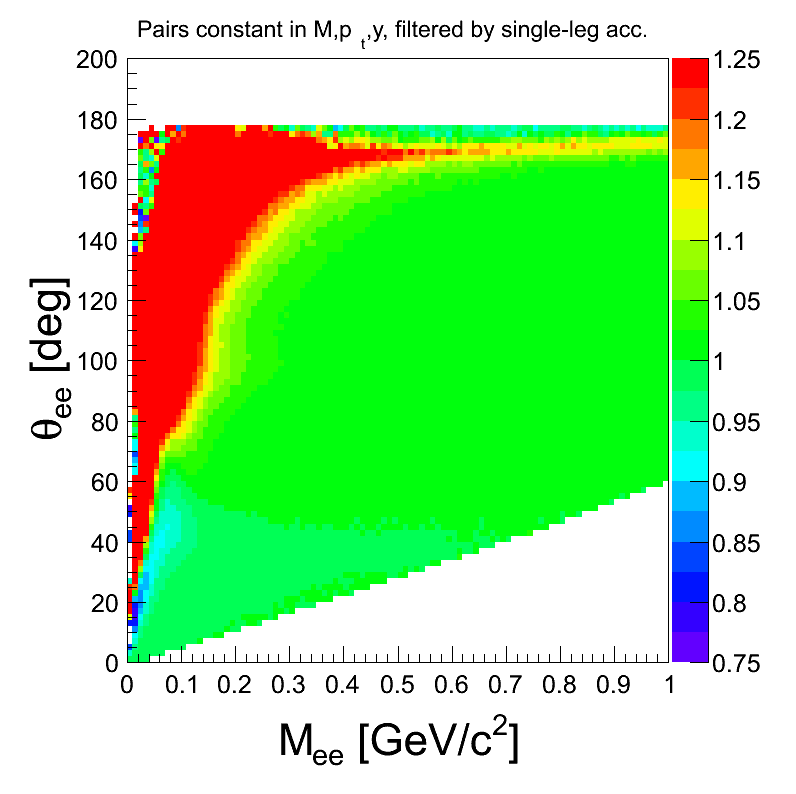
- k-factor calculated by simulating pairs with homogoneous distributions of mass, transverse momentum and rapidity, and then filtering them by single-leg acceptance matrices
| 6 sectors active | 6 sectors active | 5 sectors active | 4 sectors active the missing ones next to each other | 4 sectors active the missing ones separatedby one good | 4 sectors active the missing ones are opposite |
 |  | 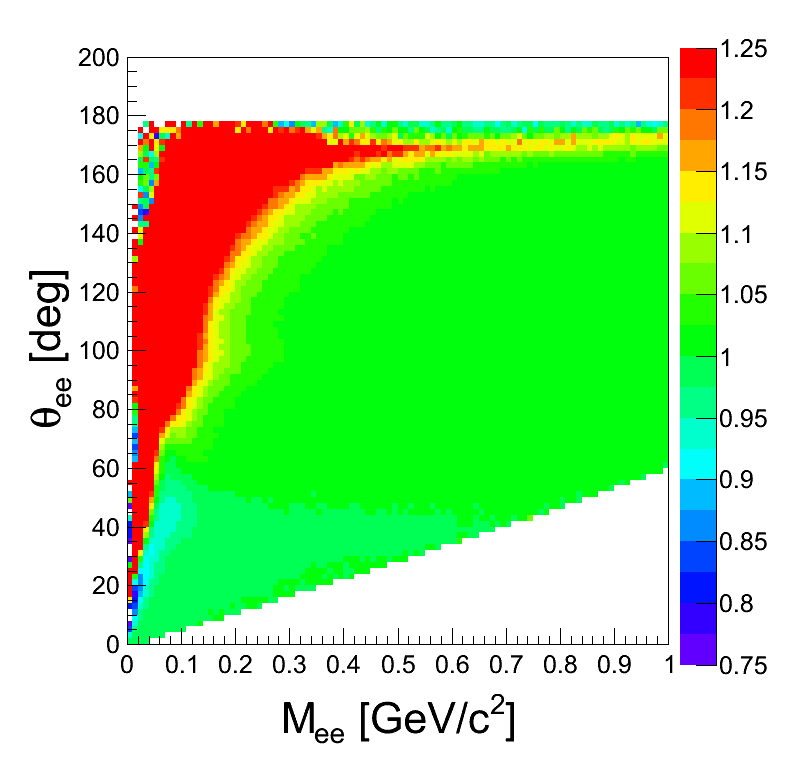 | 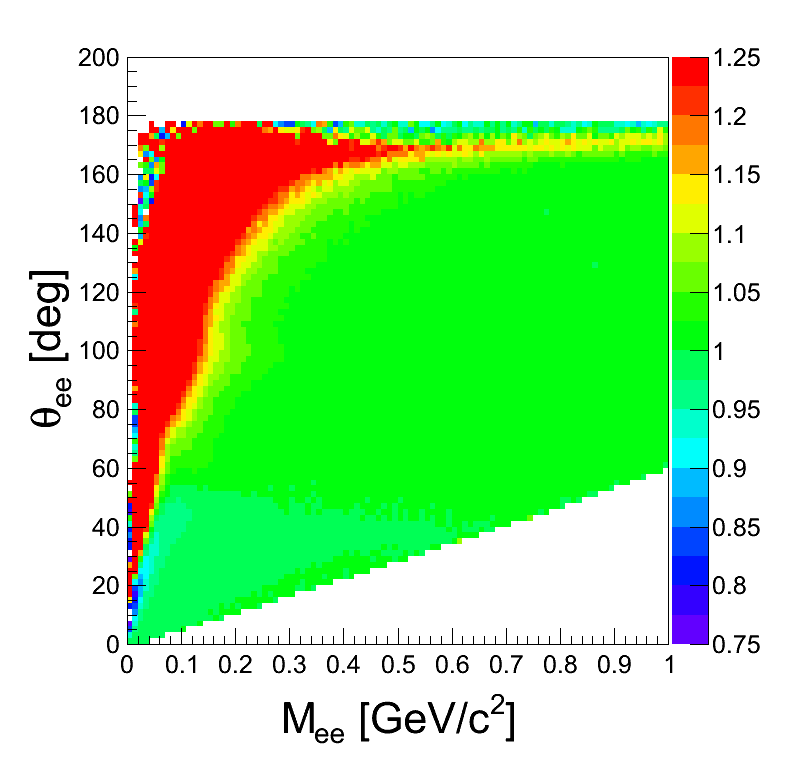 | 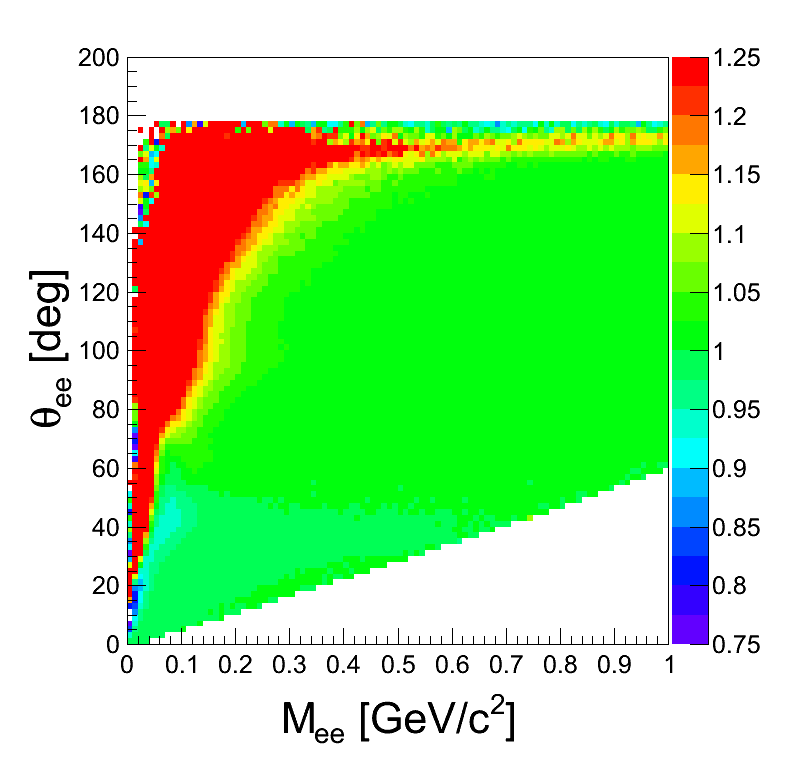 | 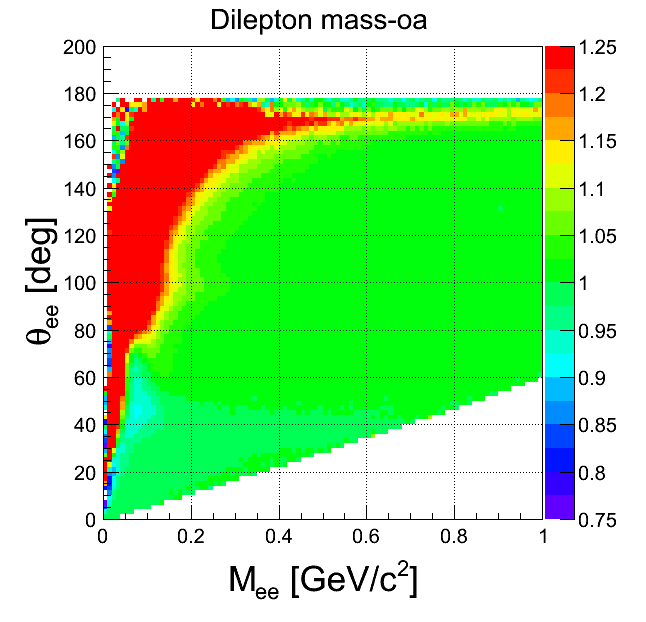 |
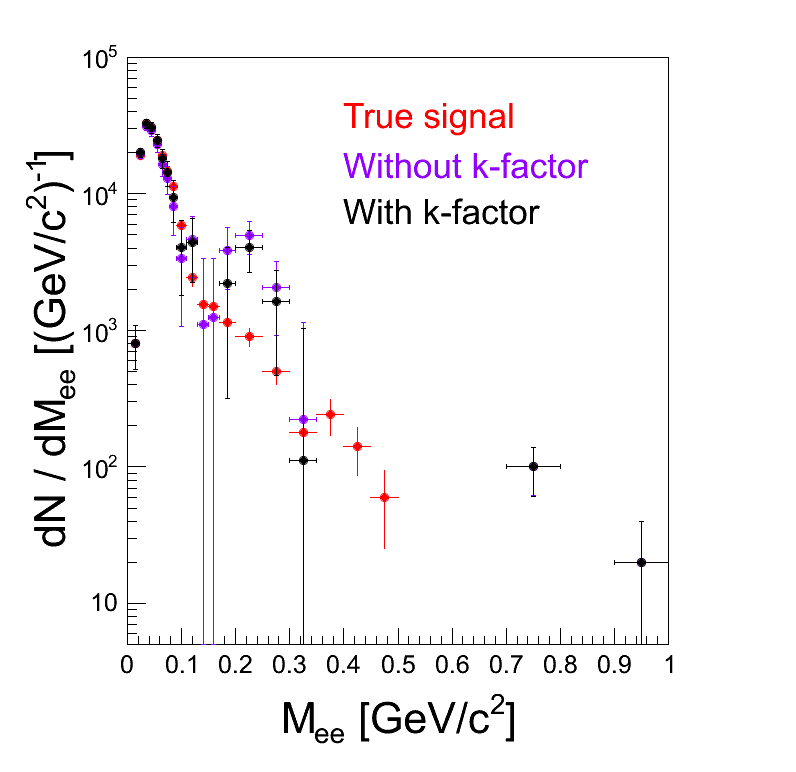
- Invariant mass signal with and without Piotr factor (for the record: spectra are corrected for single-leg efficiency /emb. to UrQMD/, the same k-factor is used in both cases, no sector factor was applied, PID was done with MLP weights No. 6)
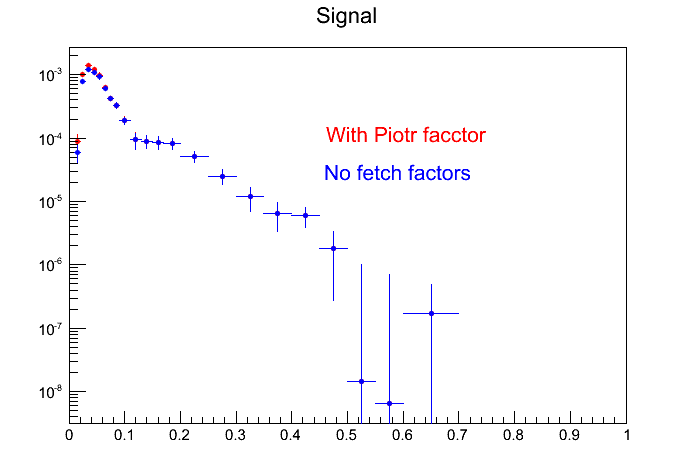 Comment:When the cut on opening angle > 9 deg is applied, only small part of the Piotr factor plays a role and only in very small masses, it has no influence above π0
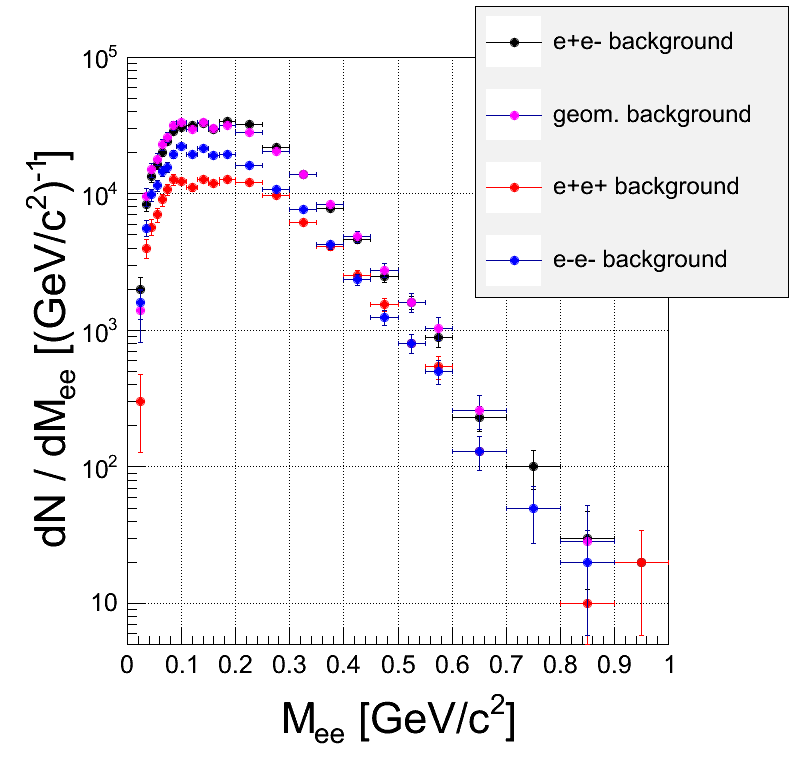
 - Combinatorial background from simulation (no corrections or fetch factors, Geant PID and reconstuction / identification cuts):
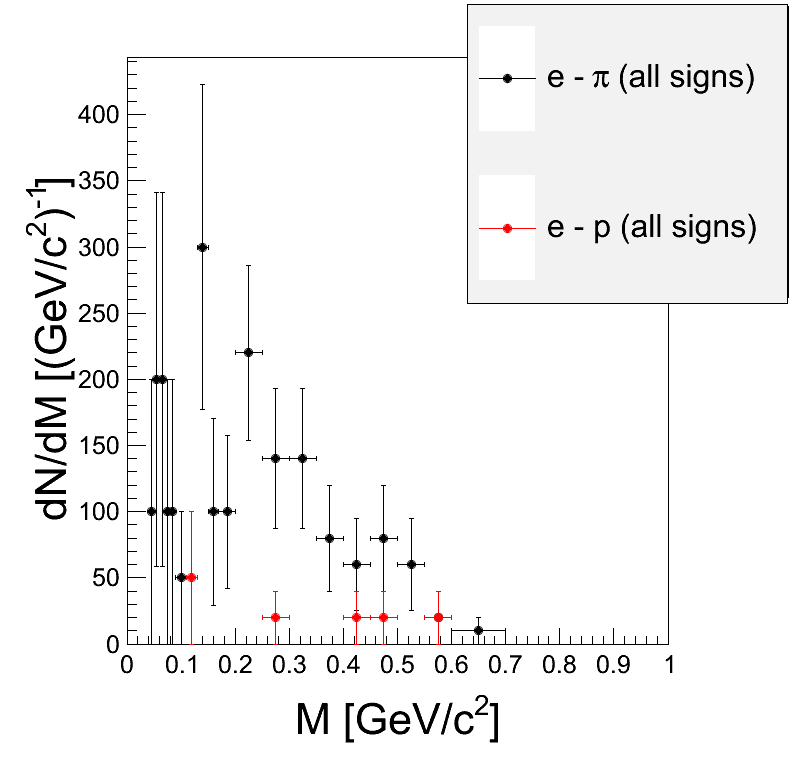
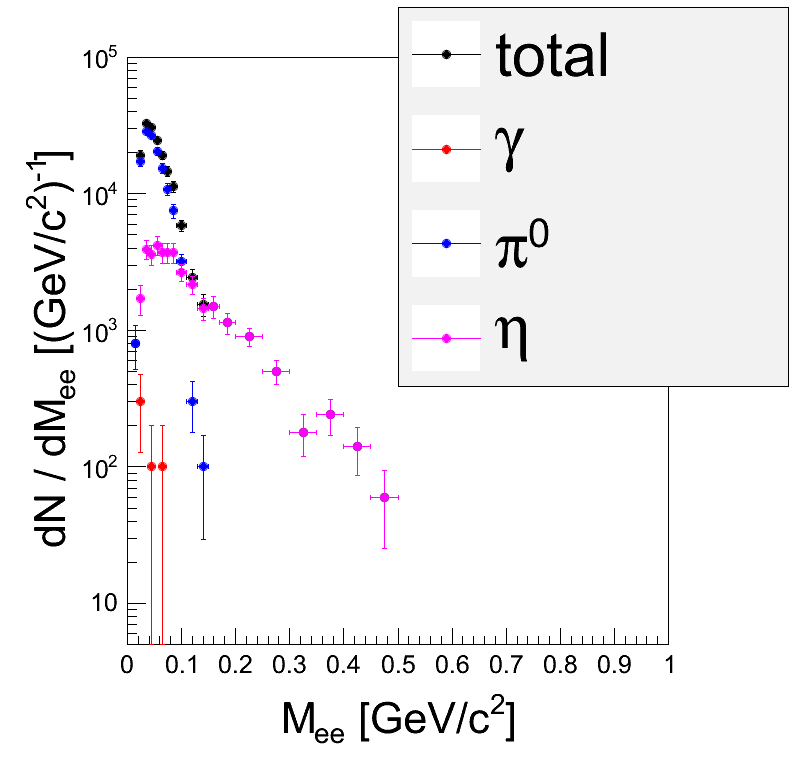
- Signal from UrQMD, left: true cocktail, right: true signal and after subtracktion like-sign background.:
-
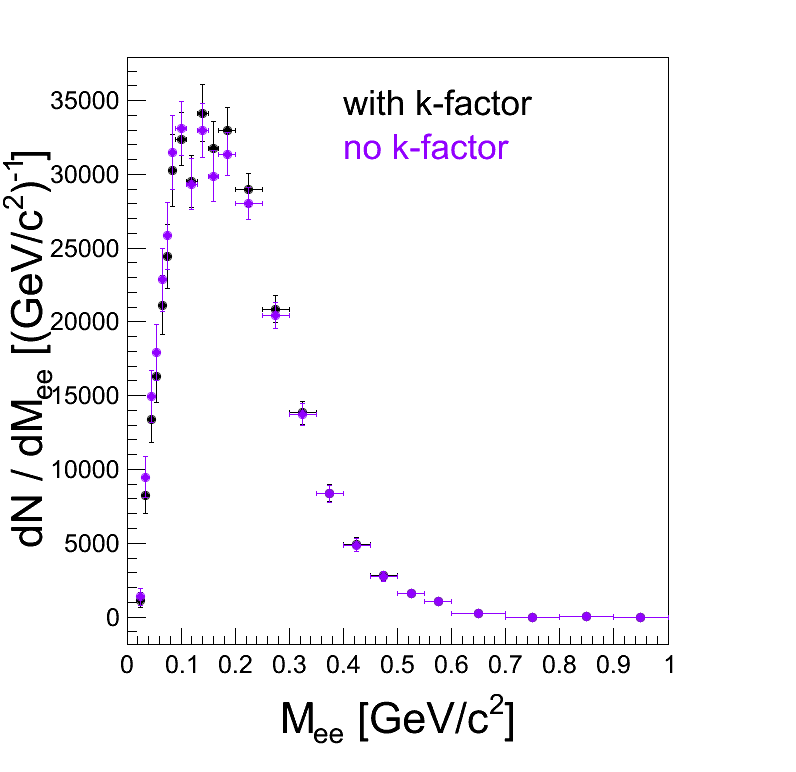
- k-factor from mixing EXP and UrQMD, with and without the efficiency correction. Background in SIM with and without k-factor.:
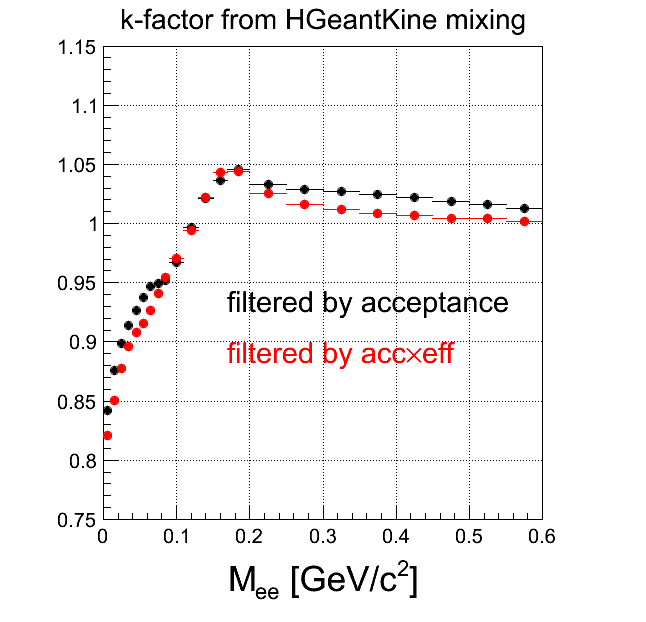
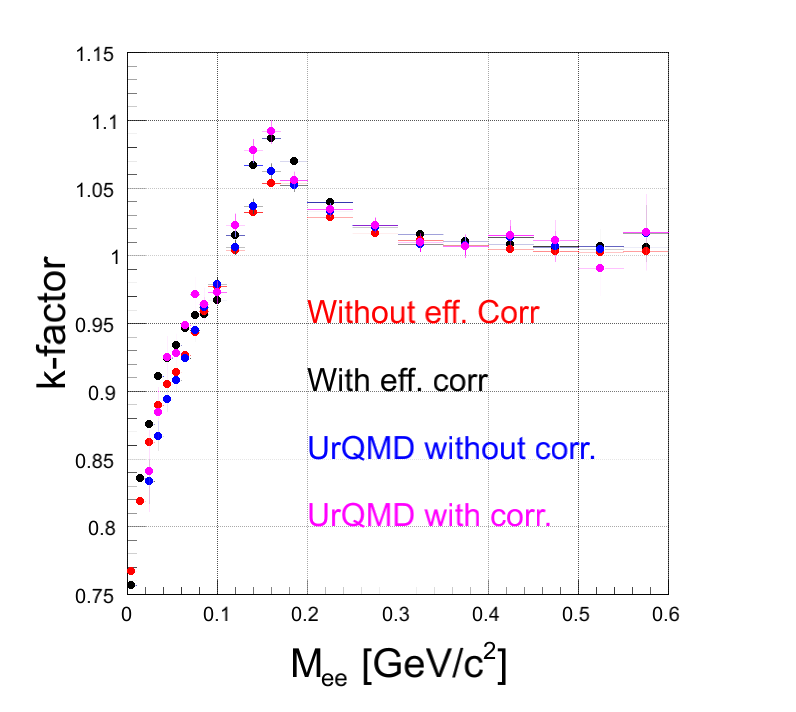
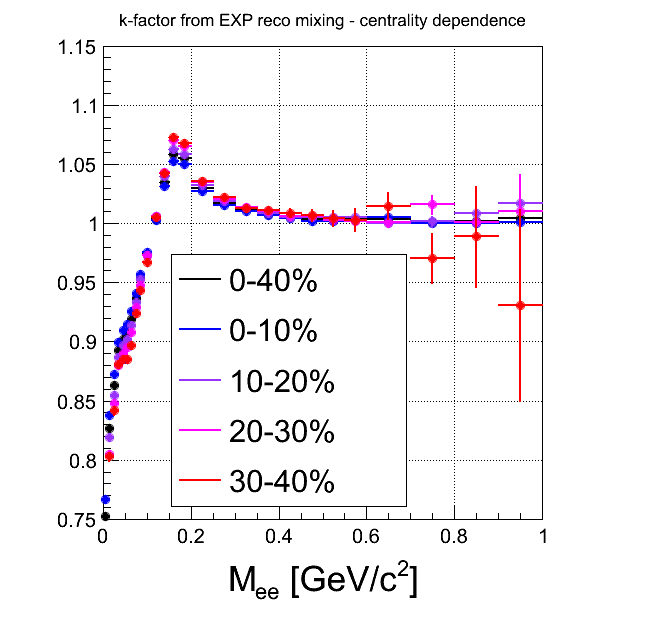
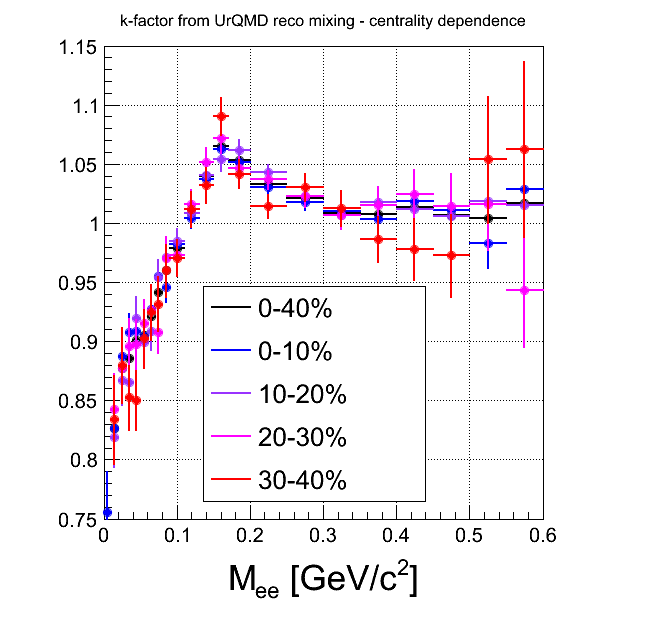
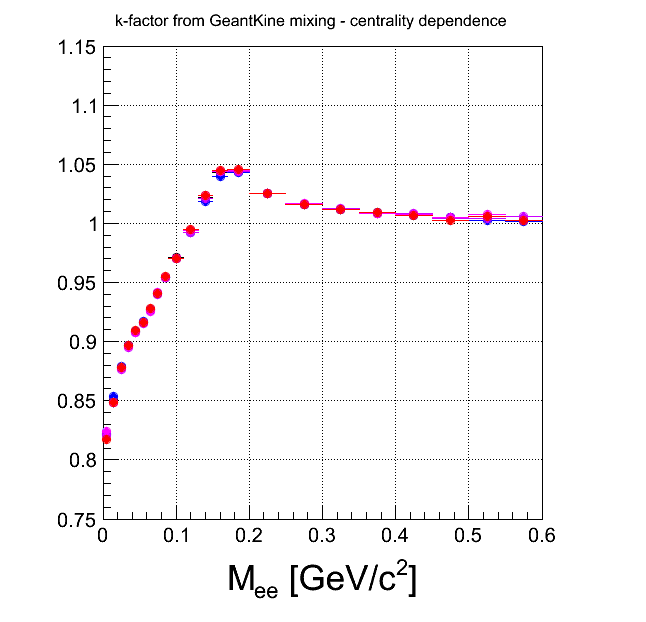 Comment There is no centraluty dependence in the level of HGeantKine filtered through one-leg efficiency. On the level of tracks reconstructed in EXP or in SIM, centrality dependence is quite similar, although SIM suffers from statistics. On the HGeantKine level filtering both legs by efficiency assumes, that efficiencies to reconstruct both leptons are indpendent. The difference to k-factor from reconstructed tracks in EXP or SIM shows, that this is not the case and there are correlations, that can depend on the multiplicity.
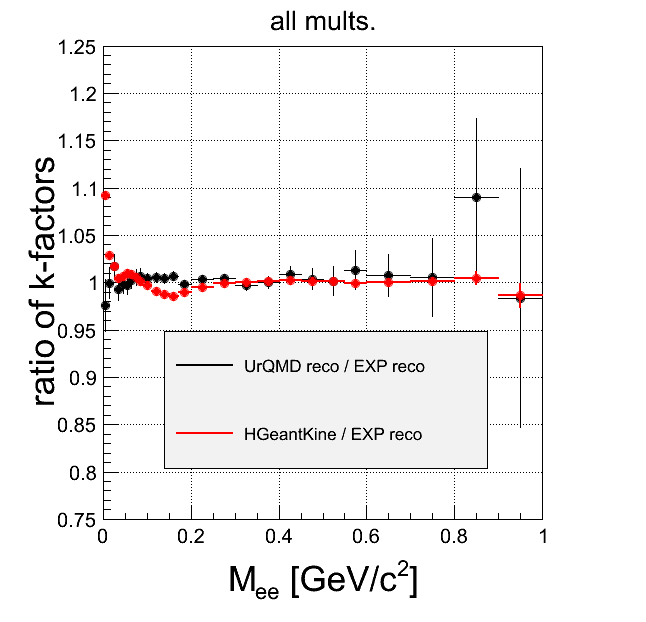
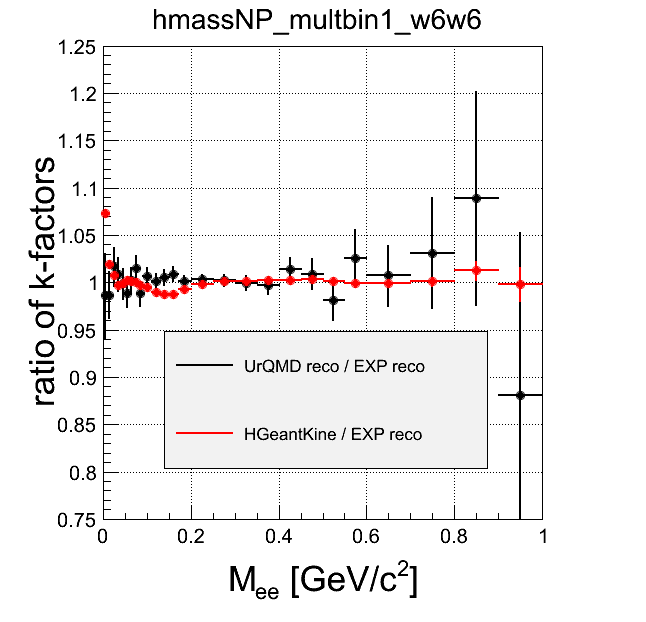
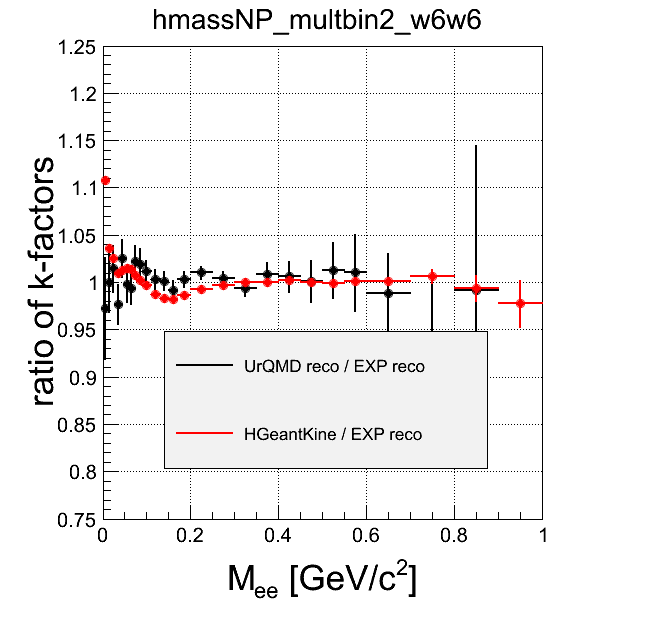
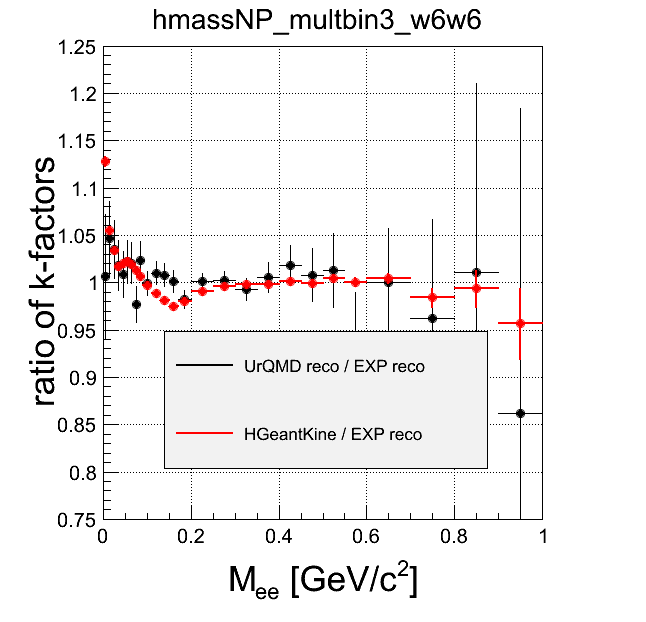
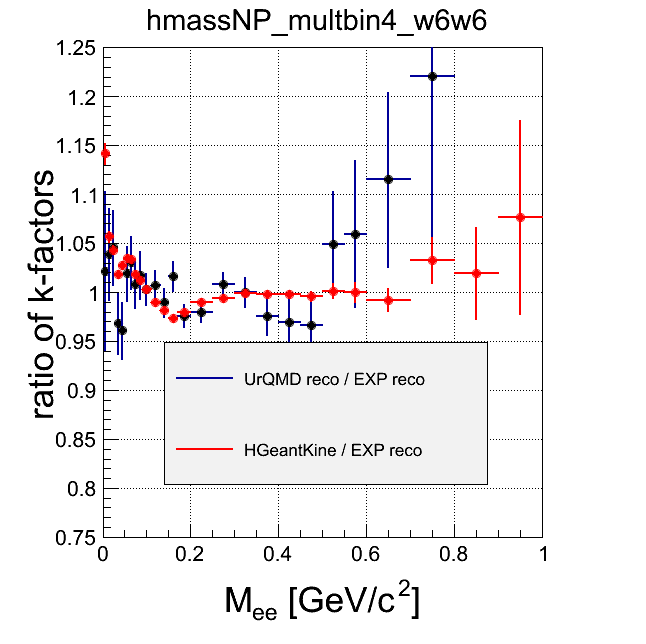 multbin1 - most central, multbin4 - most peripheral
Comment Here the difference can be seen in detail. Discrepancy betwen reco in EXP and in SIM (besides just statistics problem is SIM) may come from the fact, that not all efficiency effects (and so correlations) are reproduces in digitizers.
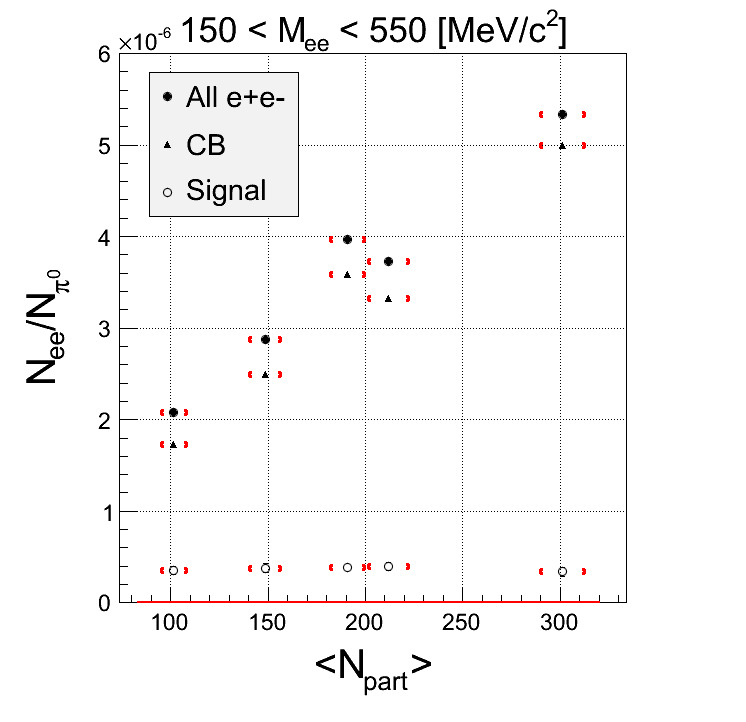
RAW withhout k-factor:
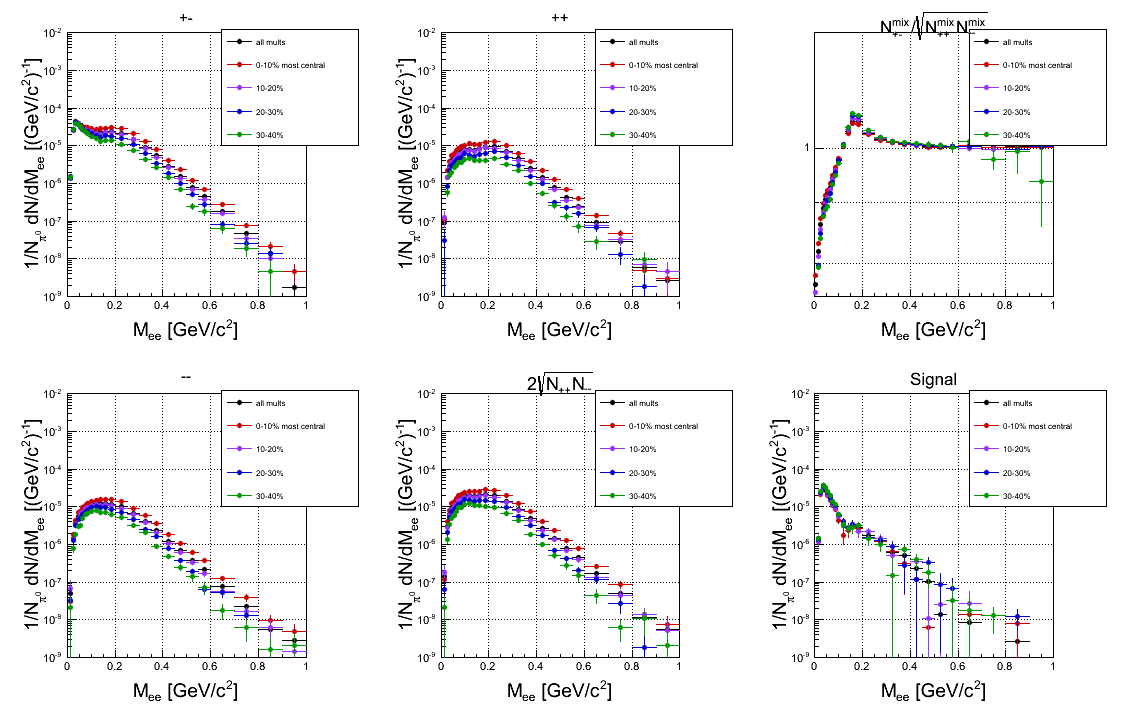
RAW with k-factor
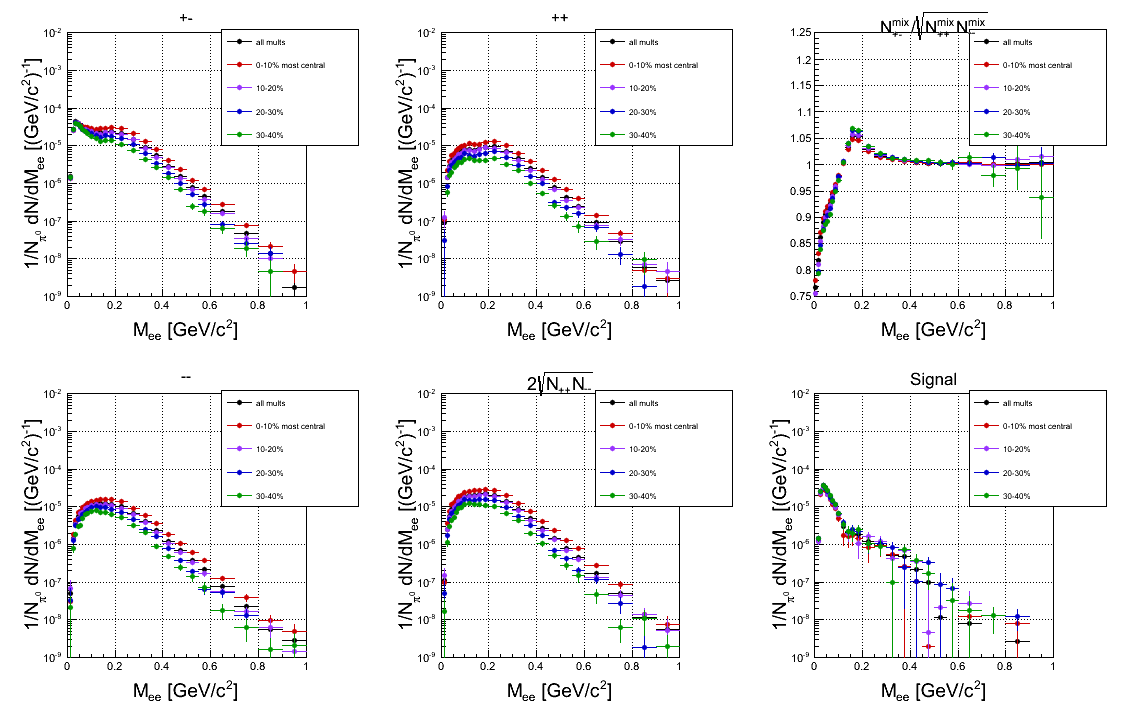
 Comment: There is no huge difference in trend whether you use k-factor or not. Even if k-factor would be wrong by 10%, you will not recover centrality dependence if you reduce this uncertainty.
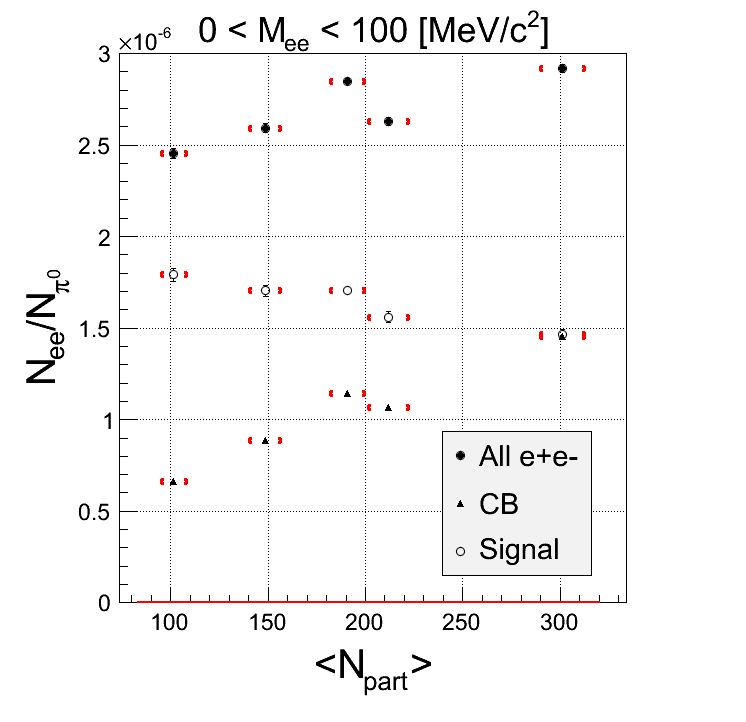
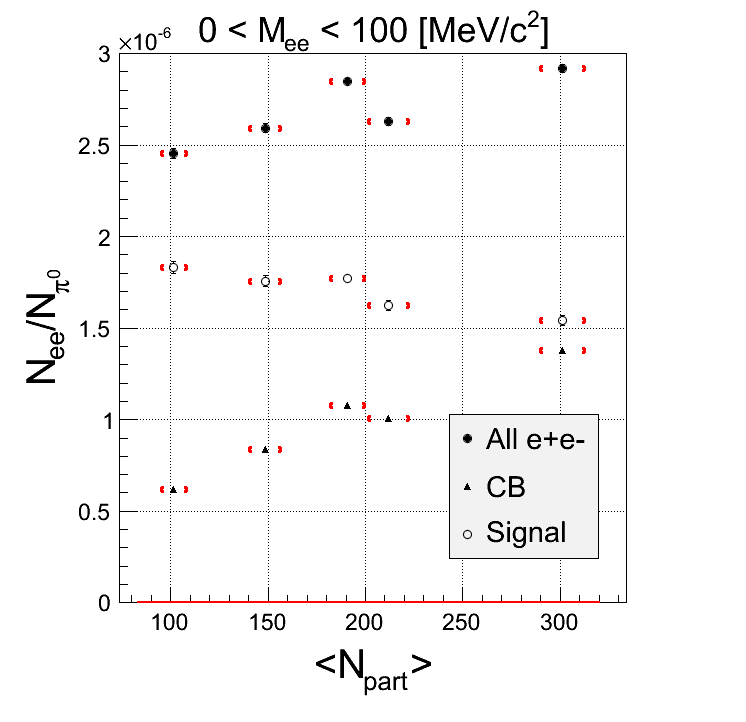
CORR withhout k-factor:
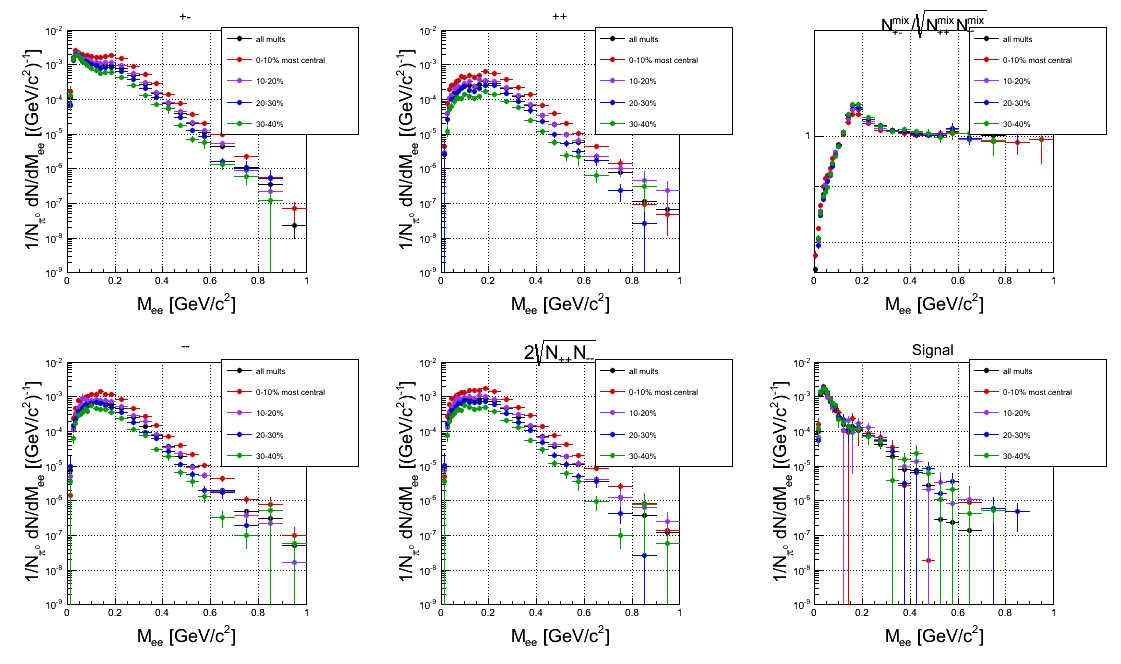
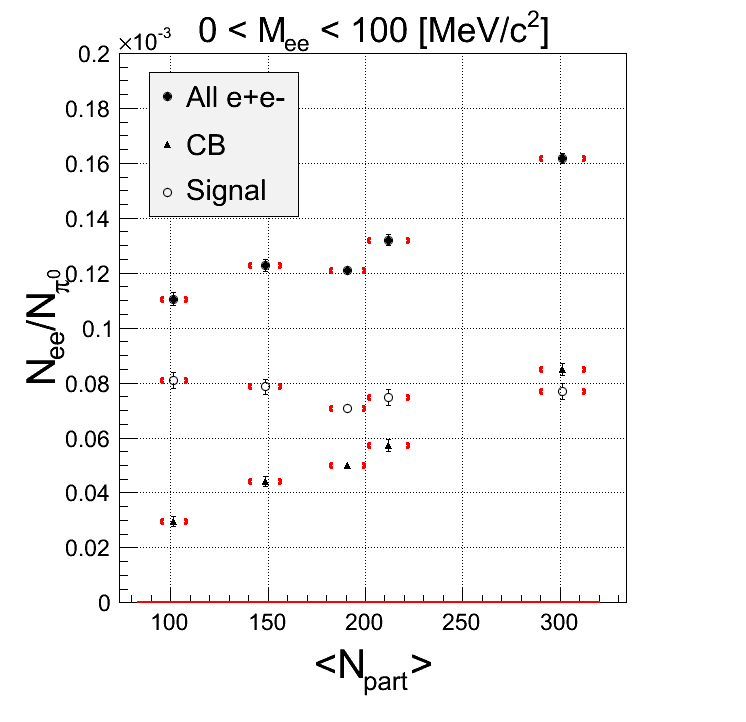
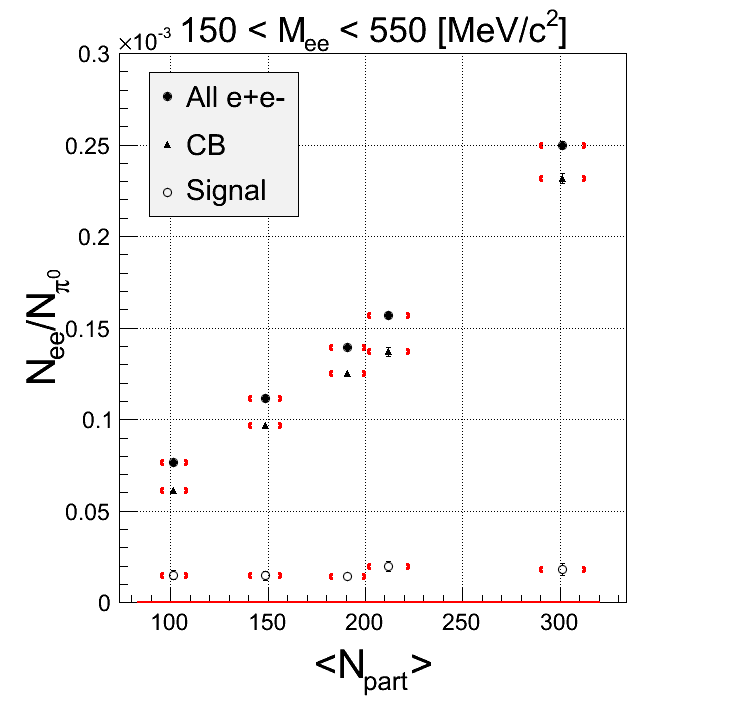 Comment: The yield below 100 MeV is more or less constant, when normalized to the number of π0. In the higher masses there is a slight trend, but within errors it is consistent with constant. When looking at all +-combinations there is a clear increase with more central events, bu it's the same in the like-sign background and therefore it's mainly canceled out in the signal.The "all PT3" bin is also slightly out of the trend.
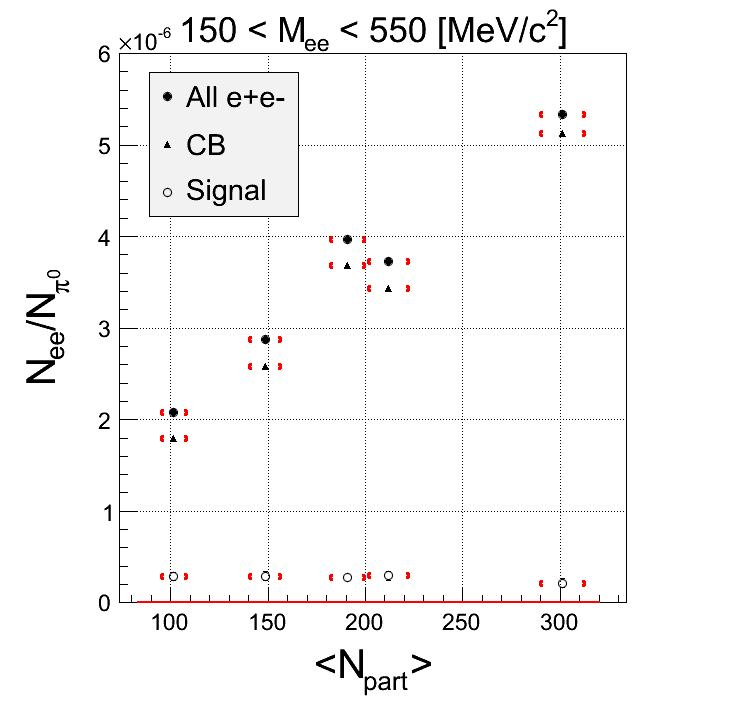
CORR with k-factor
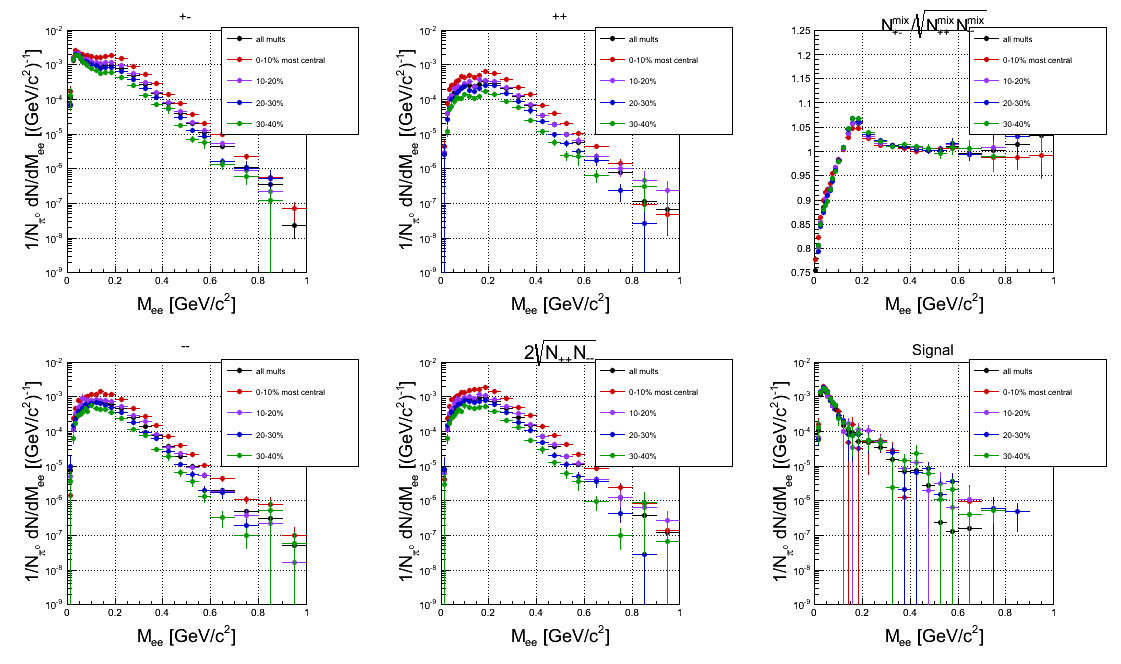
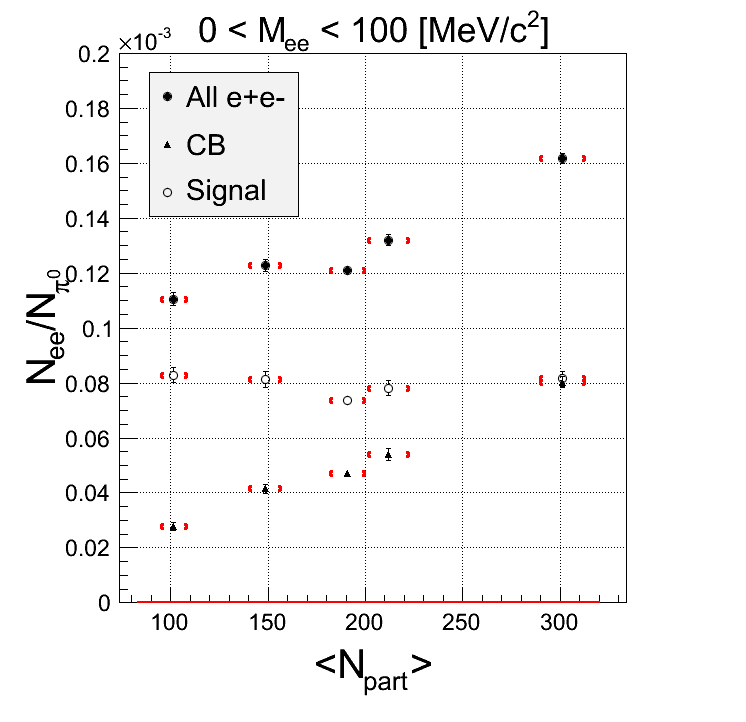
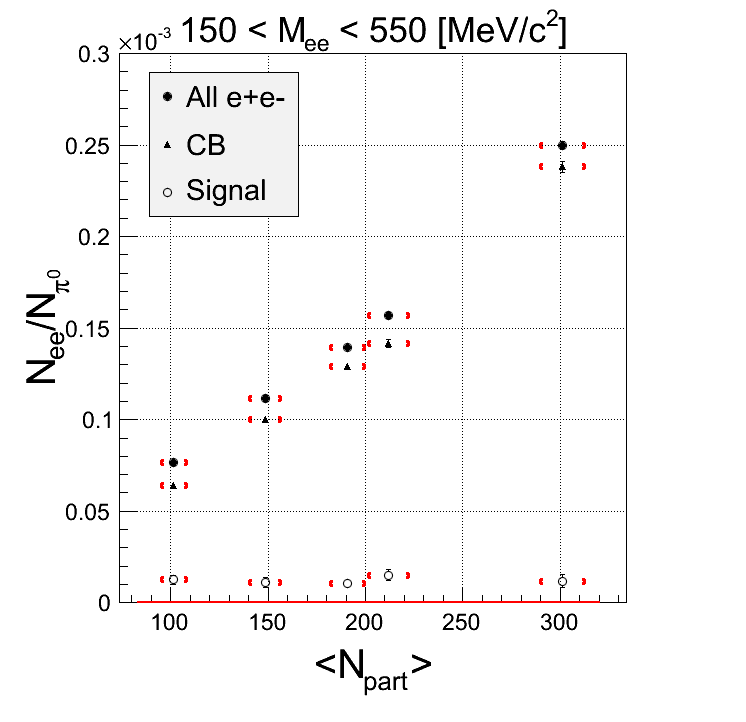 Comment: With k-factor applied, the dependence at higher masses is even reduced.
Just for fun: scale the background by 0.8 before subtracting (this is CORR without k-factor)
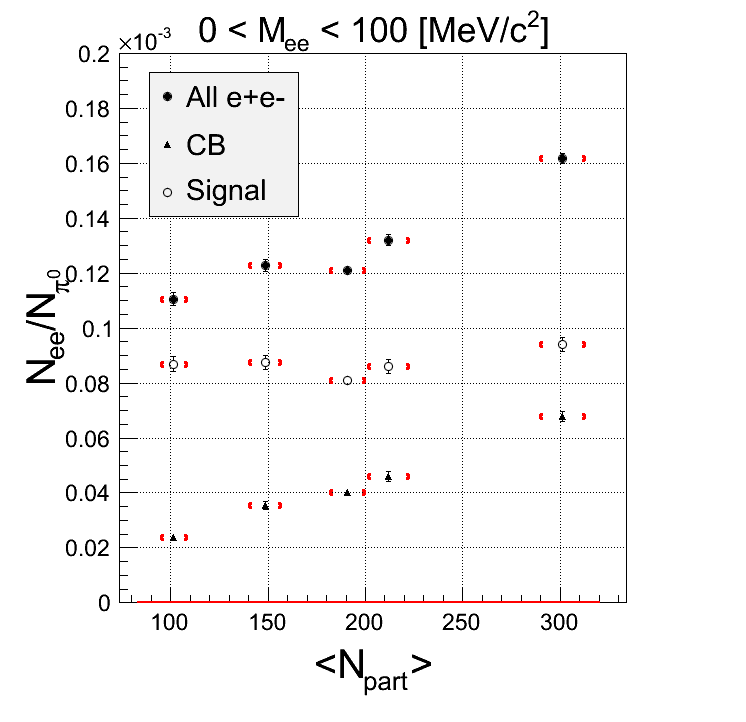
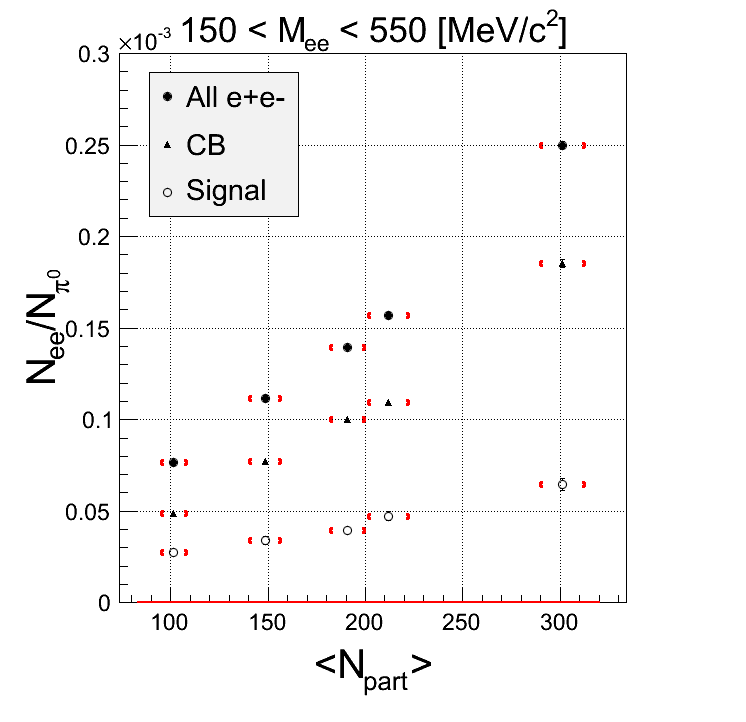
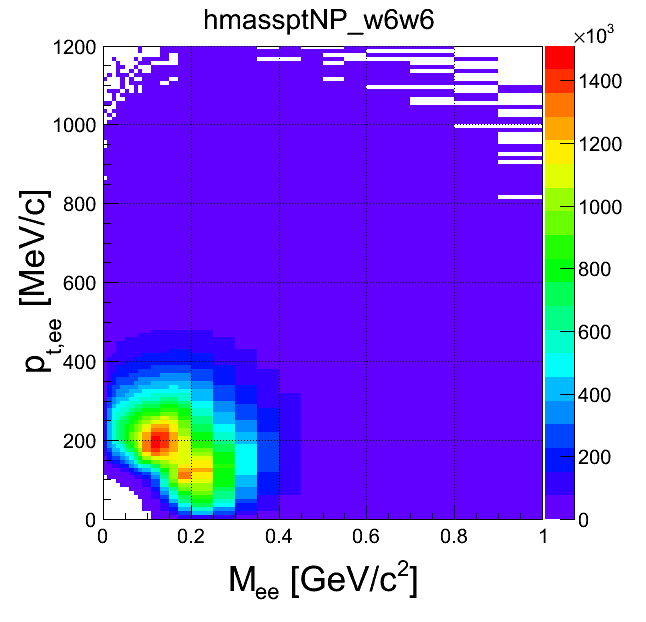
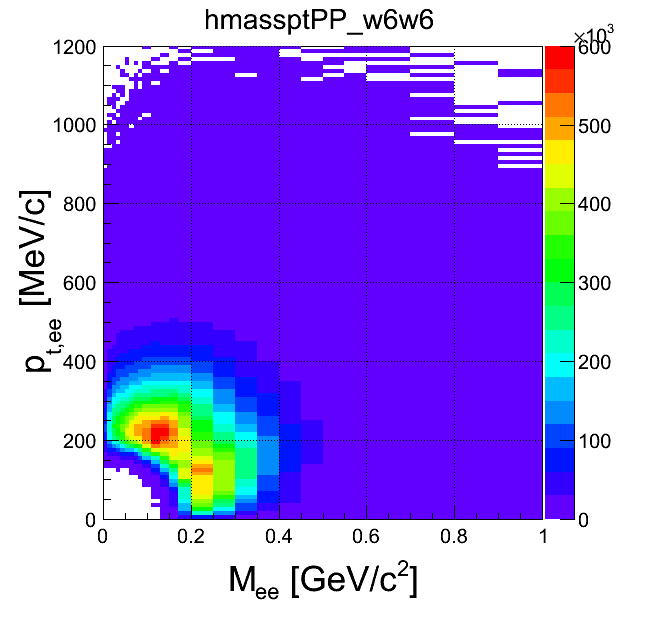
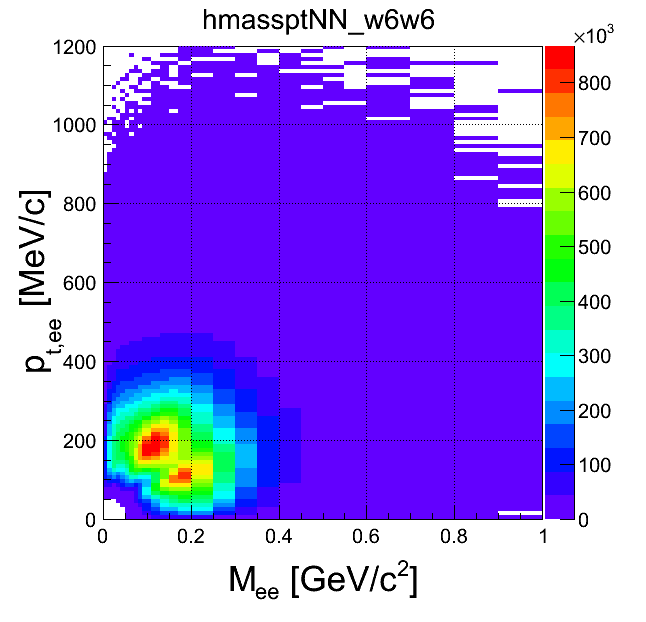
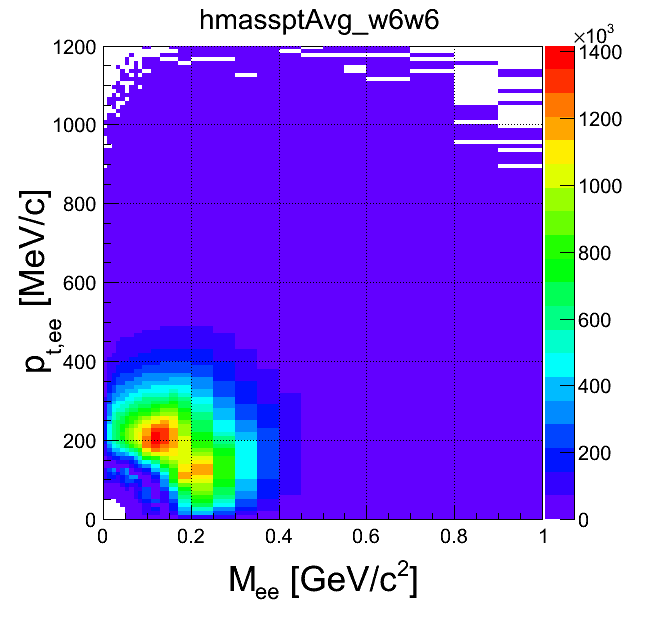
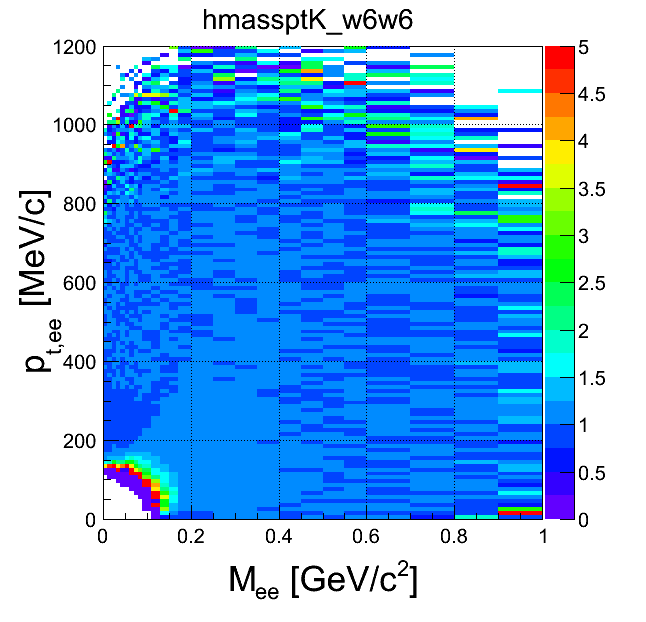
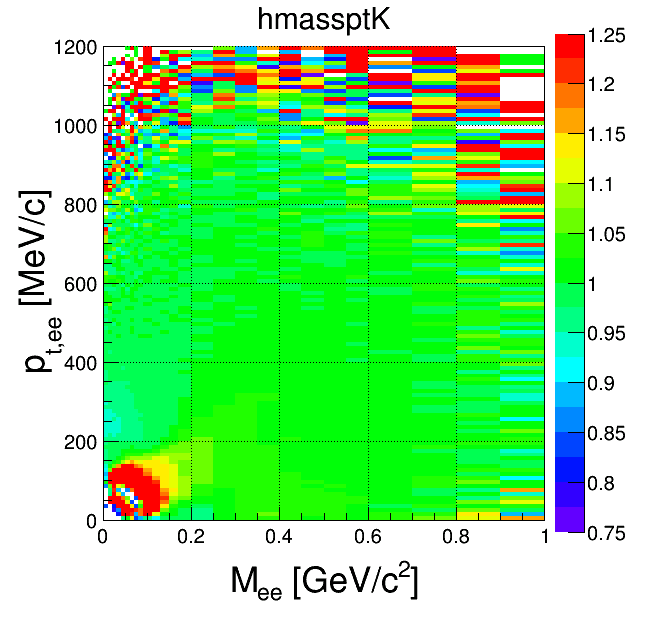
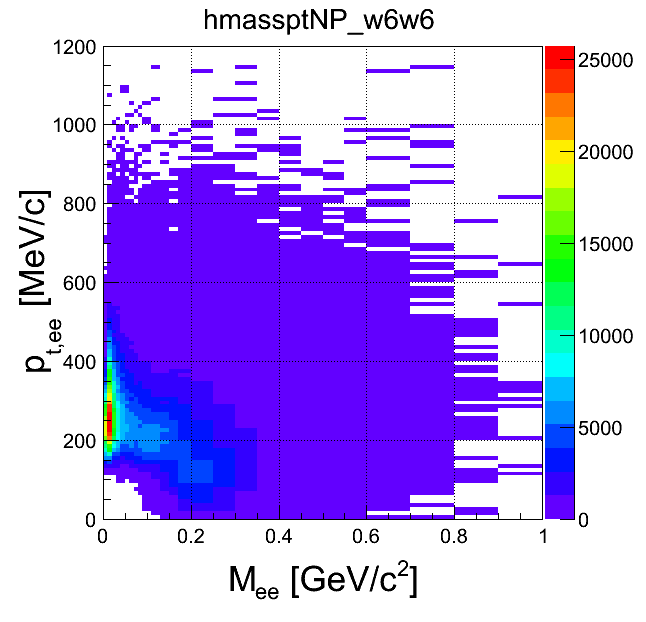
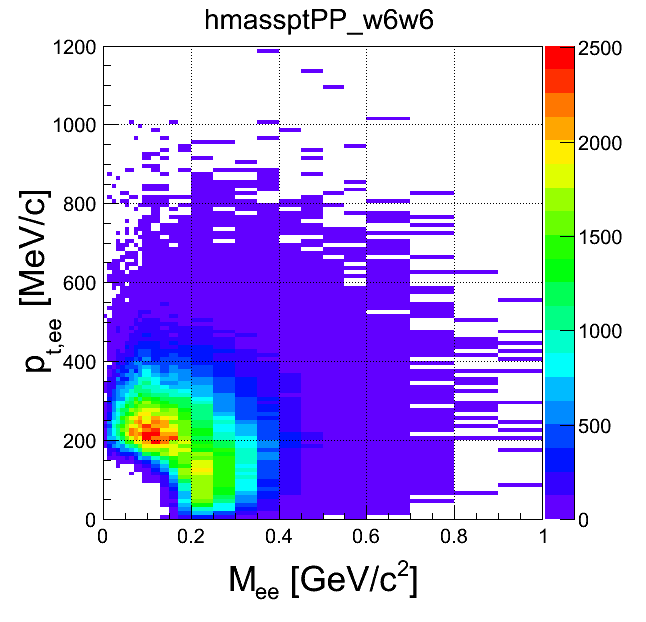
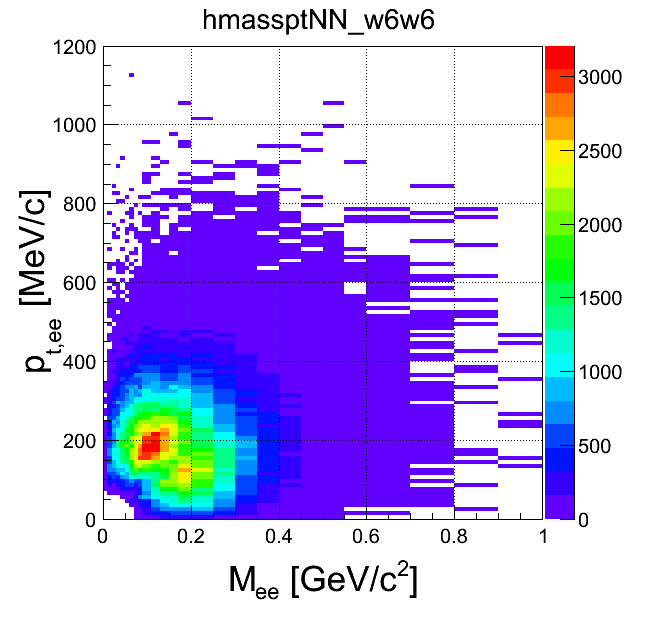
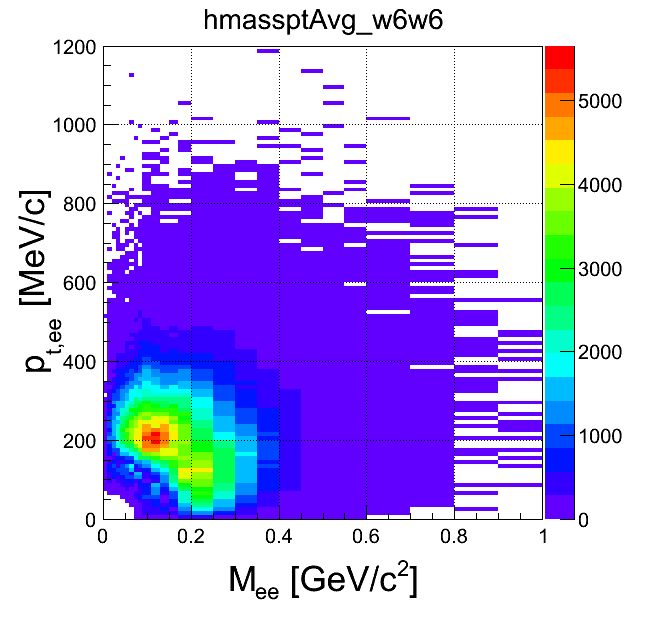
mass-pt:
| +- mixing | ++ mixing | -- mixing | geom. avg. mixing | k-factor | k-factor Kine mixing |
 |
 |
 |
 |
 |
 |
| +- data | ++ data | -- data | geom. avg. data | signal data | |
 |
 |
 |
 |
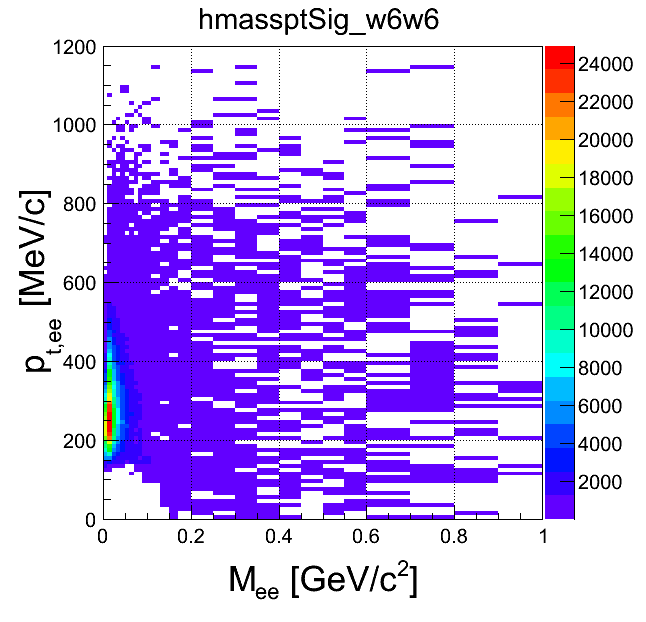 |
-- pairs are present and only they are taken as the background. Then there are borth ++ and --, but there are only few ++and this reduces the geometric average. Then there is sufficient amount of both signs and the average has a reasonable value. As a consequence the average is artificially jumping up and down and this is reflected also by the k-factor.
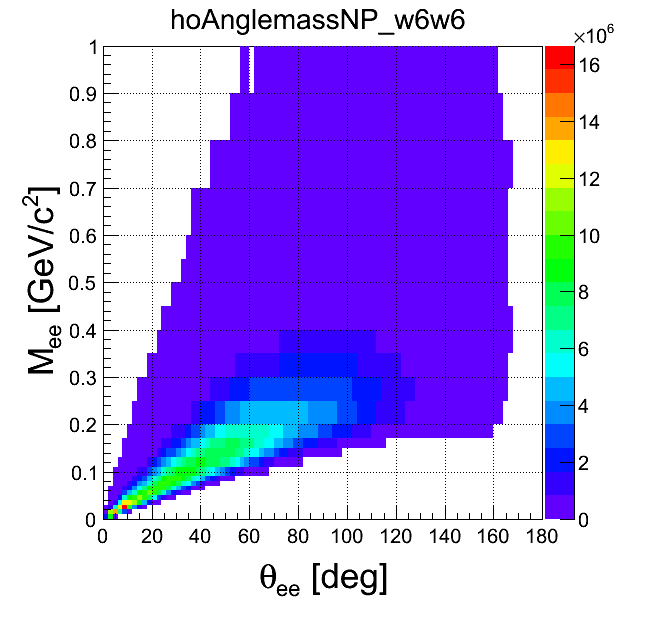
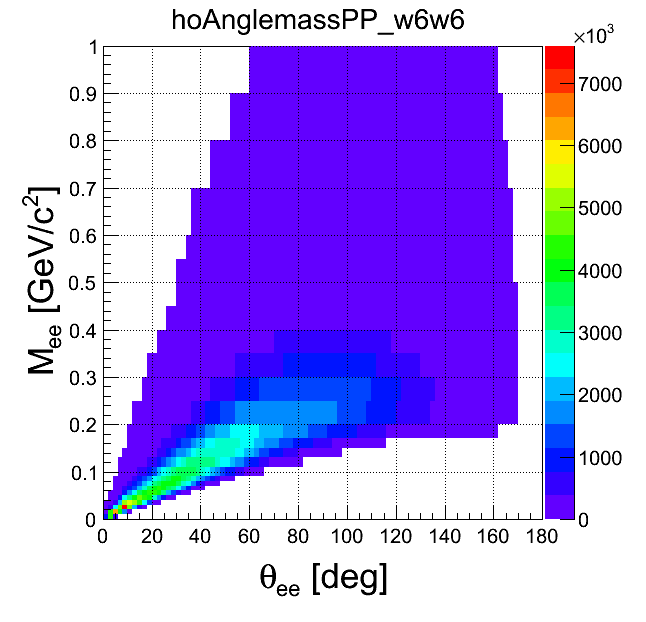
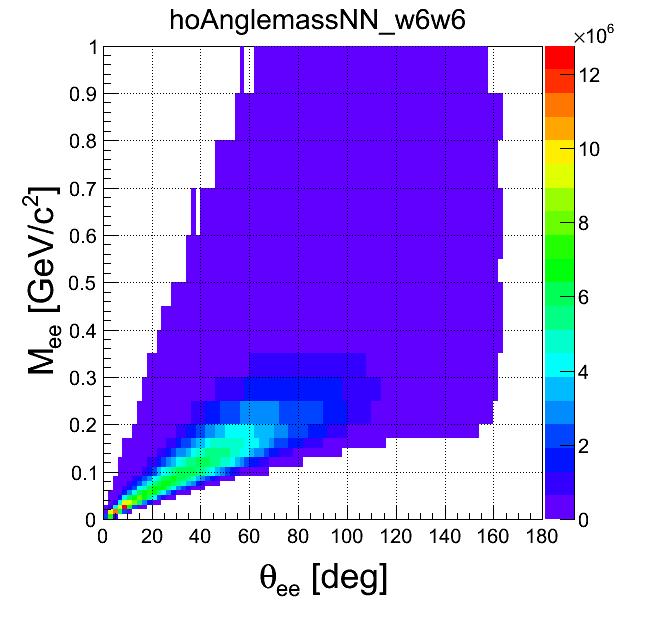
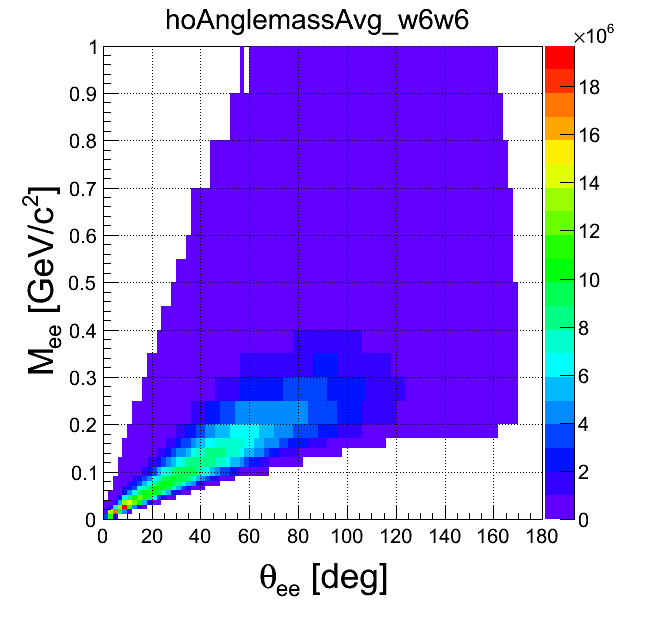
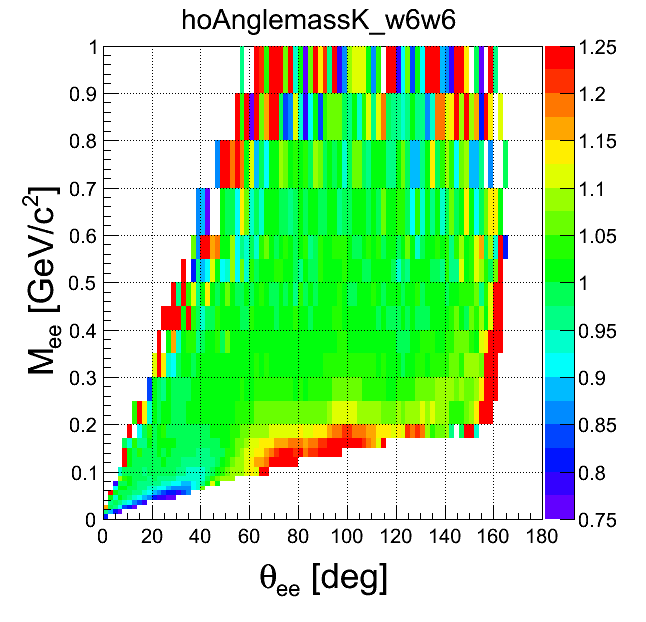
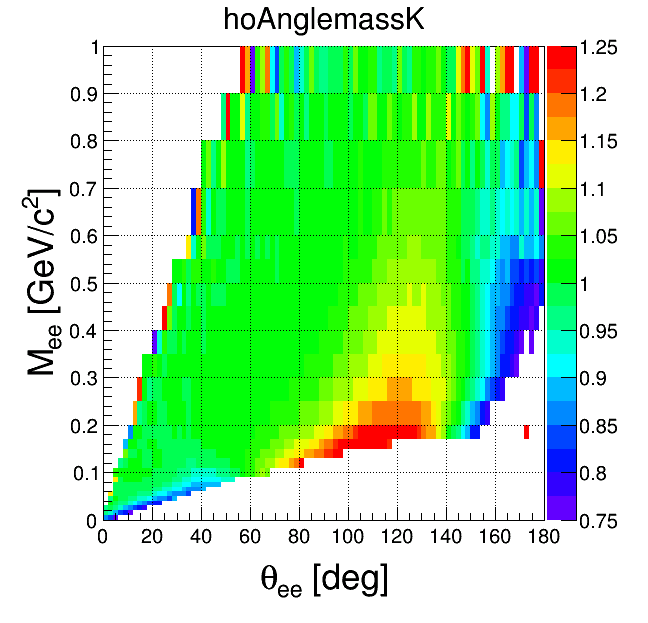
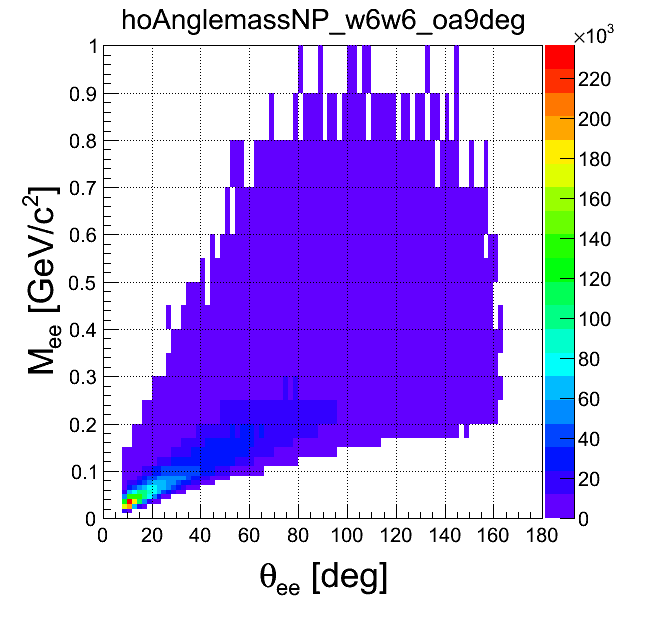
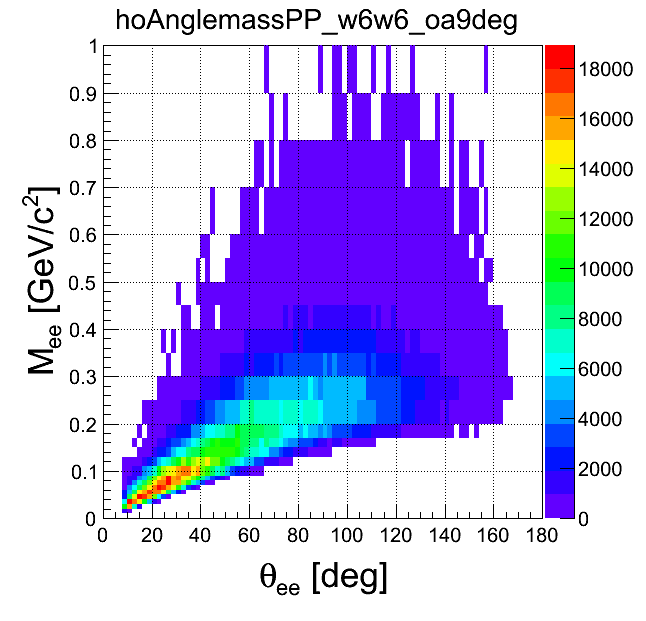
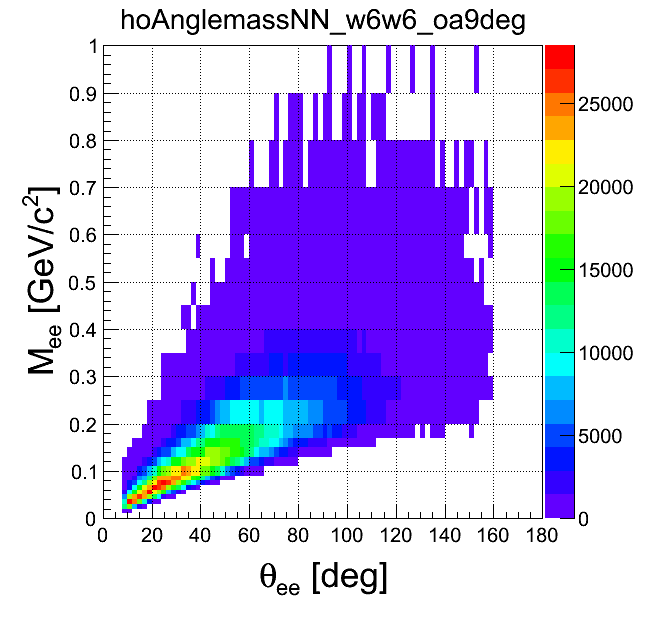
mass-opening angle
| +- mixing | ++ mixing | -- mixing | geom. avg. mixing | k-factor | k-factor Kine mixing |
 |
 |
 |
 |
 |
 |
| +- data | ++ data | -- data | geom. avg. data | signal data | |
 |
 |
 |
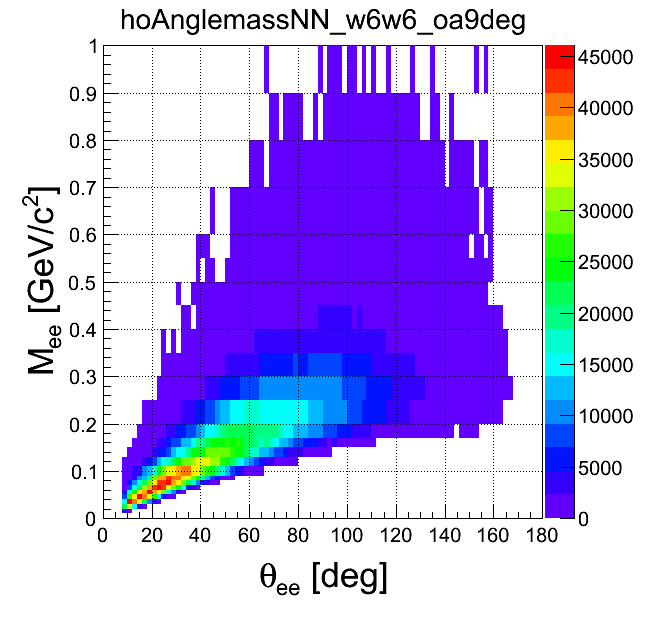 |
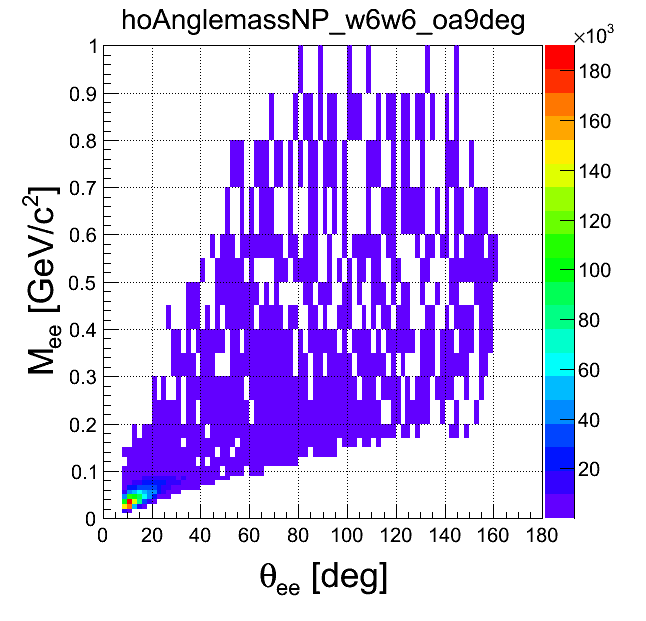 |
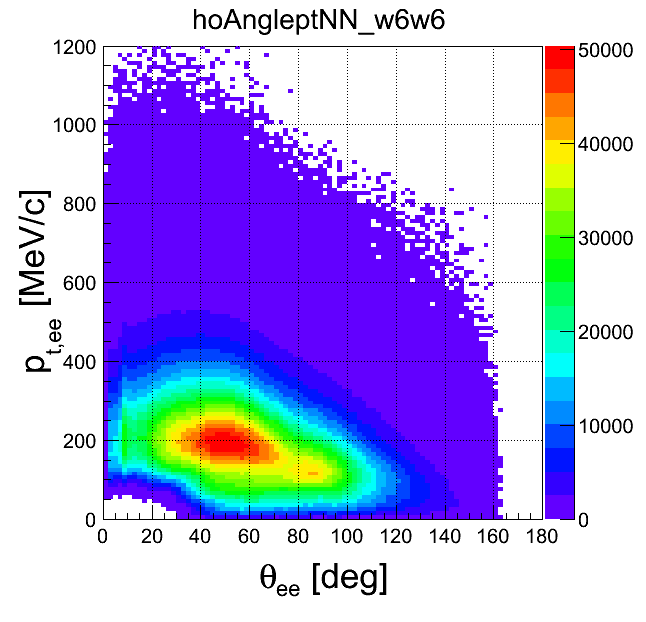
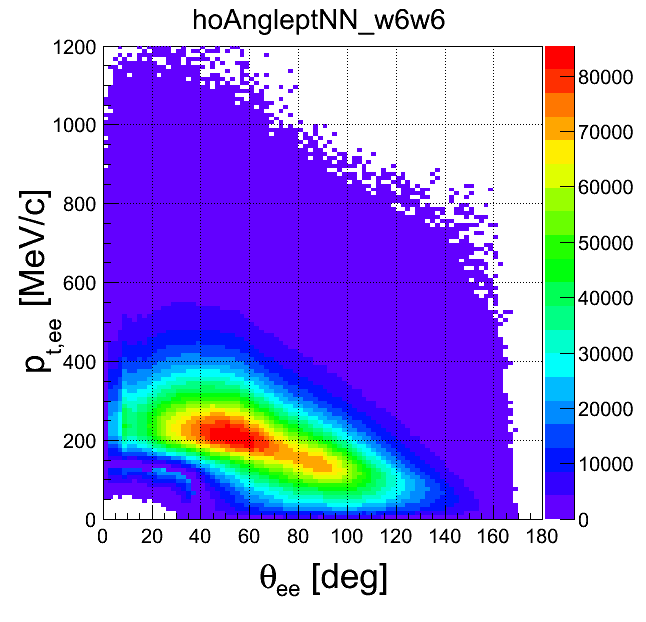
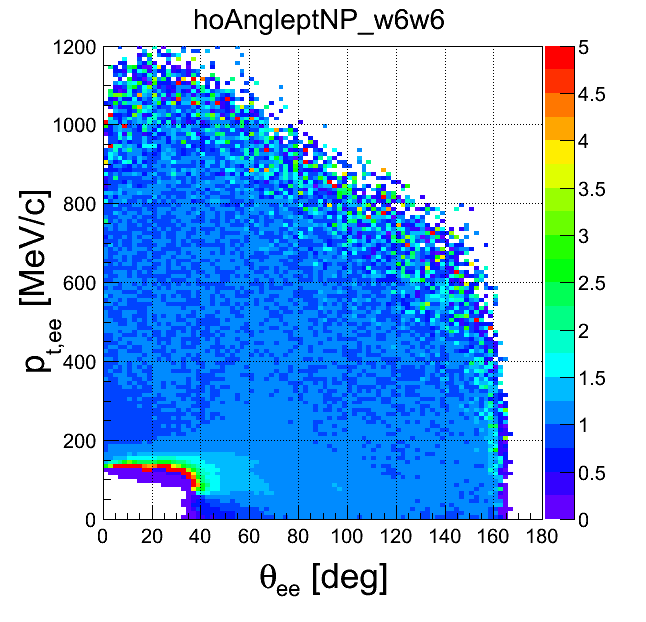
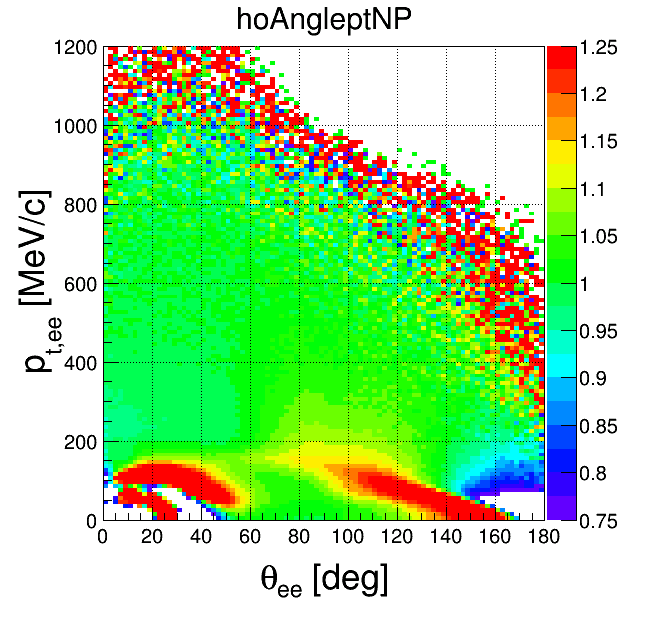
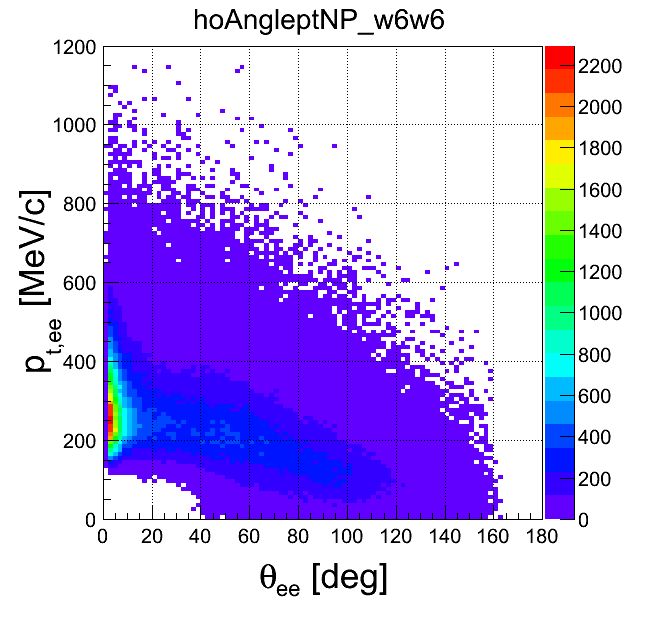
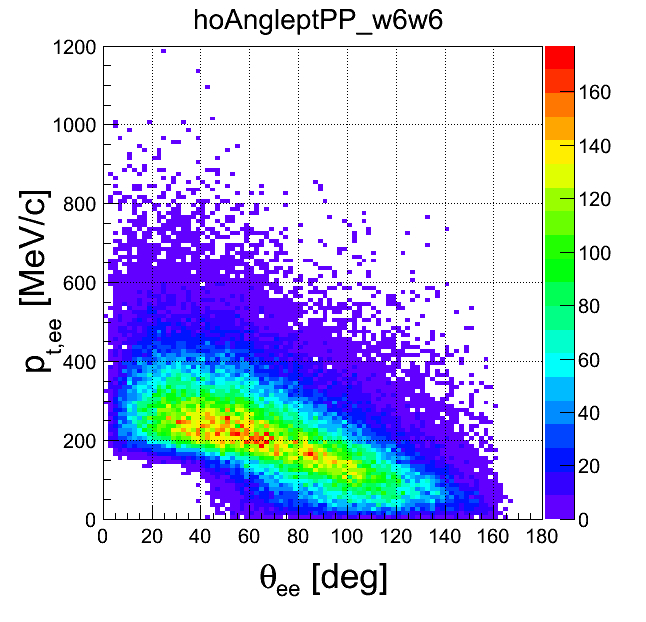
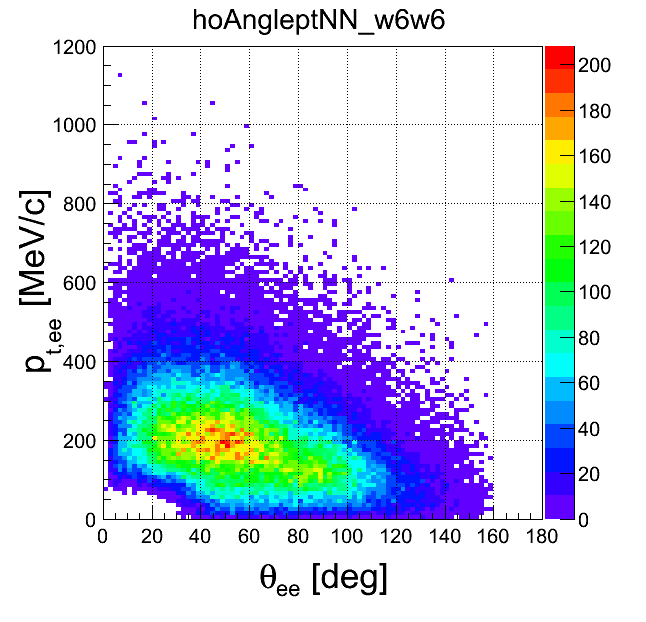
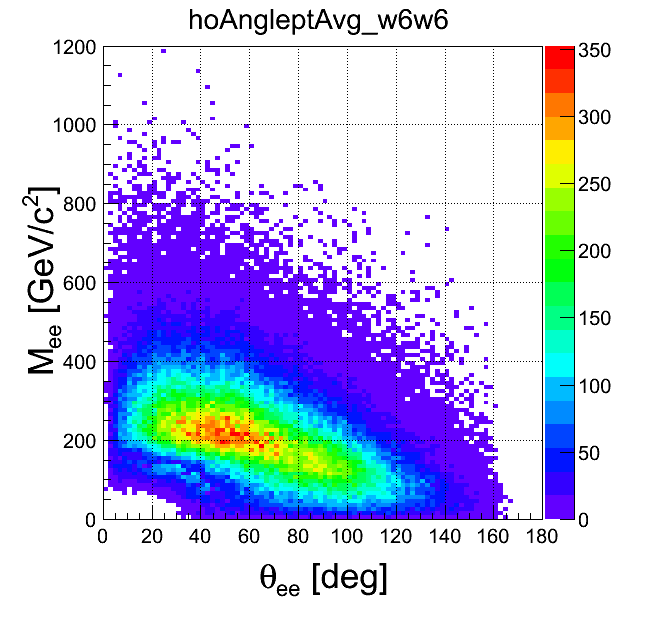
pt-opening angle
| +- mixing | ++ mixing | -- mixing | geom. avg. mixing | k-factor | k-factor Kine mixing |
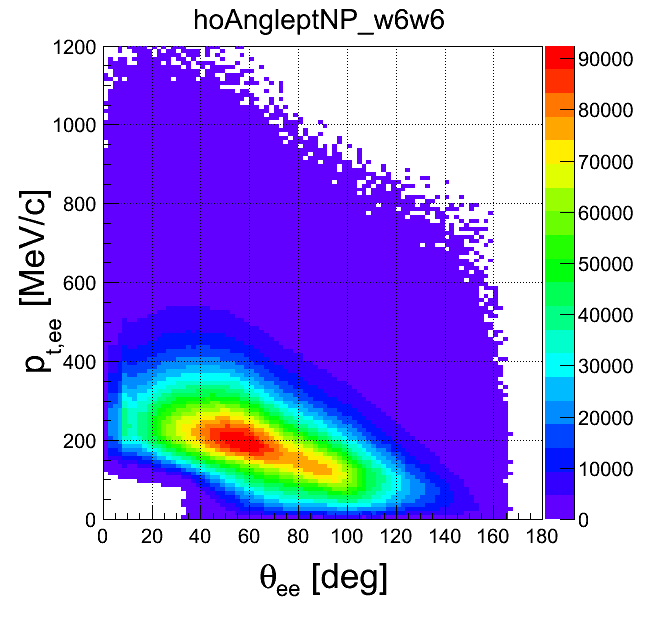 |
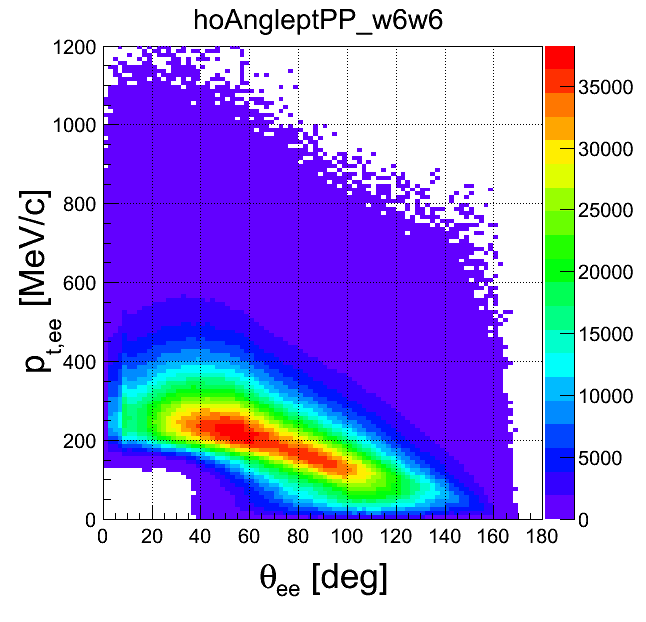 |
 |
 |
 |
 |
| +- data | ++ data | -- data | geom. avg. data | signal data | |
 |
 |
 |
 |
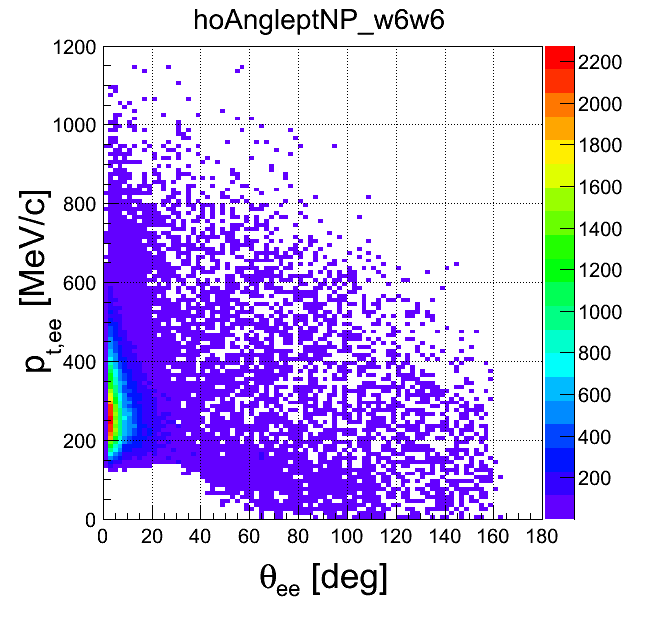 |
Edit | Attach | Print version | History: r9 < r8 < r7 < r6 | Backlinks | View wiki text | Edit wiki text | More topic actions
Topic revision: r9 - 2016-02-29, SzymonHarabasz
Copyright © by the contributing authors. All material on this collaboration platform is the property of the contributing authors.
Ideas, requests, problems regarding Foswiki Send feedback | Imprint | Privacy Policy (in German)
Ideas, requests, problems regarding Foswiki Send feedback | Imprint | Privacy Policy (in German)

