You are here: Foswiki>Homepages Web>CreateHomepageTopic>HomepageGosiaSudol>HowmepageGosiaSudolFinalPlots>HowmepageGosiaSudolFinalPlotsFinal_plots (2019-10-22, GosiaSudol)Edit Attach
Fig.2 - x axis label "y": change to y_cm
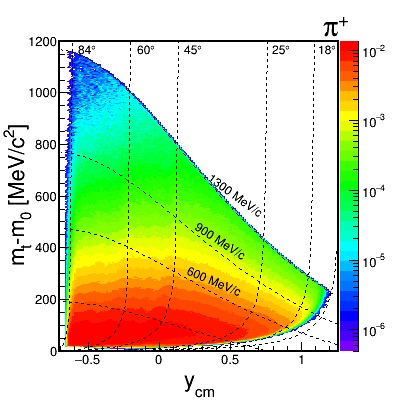
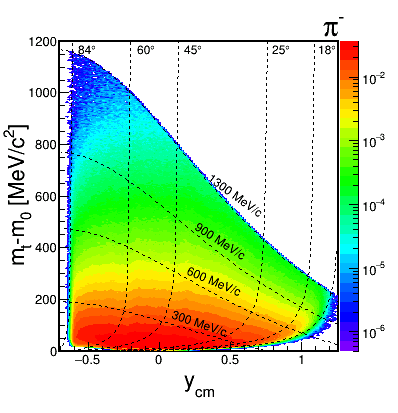 Fig.4 - still missing data points (pi+, target-like rapidity)
- rapidity window should be shown in y_cm, not y_lab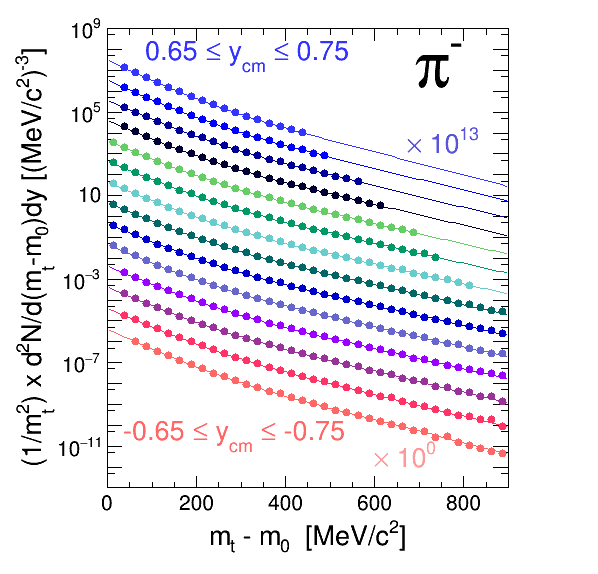
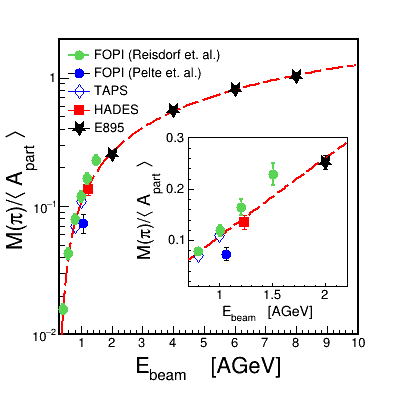
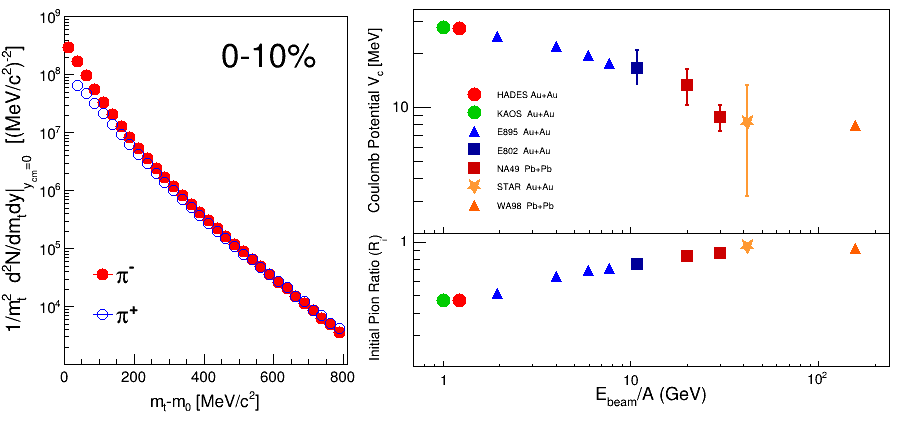
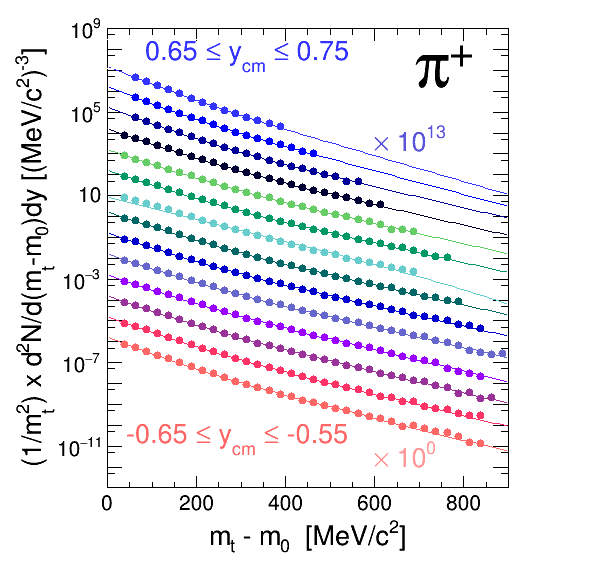 - Fig. 7 needs units on the abscissa of the left panel (Ebeam). (Note suppressed zero on the ordinate.)
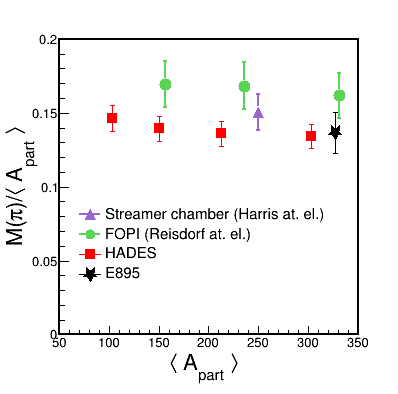 - Fig.8: I propose to remove the N+N point. It is not a HADES
measurement and should be close to the C+C point. It would raise many
questions which, however, have no impact on the paper content.
If you disagree, leave it as is and we discuss it next week. DONE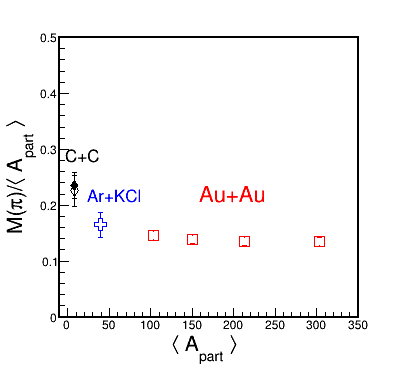
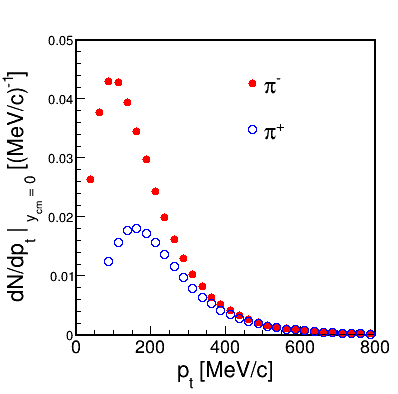
- Fig.9 Please change the range of the pt axis to 0- 800 MV/c . Also for pi+ open symbols were added. DONE
 -Fig10. I changed y_axis on left side and also for pi+ made open symbols to be consistent with other plots.
 - Fig.11 c,d: I proposed to have the corresponding pcm distributions
here. If you prefer not to have them, do nothing. I do not see need for this plot in that chapter, since all plots are integrated over rapidity.
- Fig.13: please put <A2> on the ordinate and make pi+ open symbols and
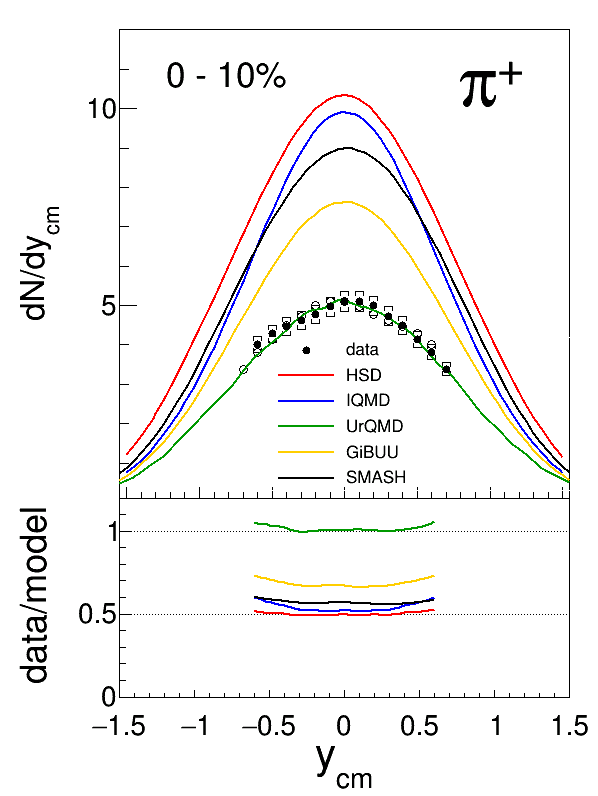
pi- closed symbols as for C+C. Proper label to that plot : Mean anisotropy parameter <A_2> as a function of the mean number of participants <A_part>. Circles represent experimental Au+Au data (open: pi+, closed pi-). Also shown are earlier HADES results on <A2> average on pi+ and pi- for C+C at 1AGeV (closed triangle) and 2AGeV(open triangle) as well as Ar+KCl at 1.75AGeV (open cross).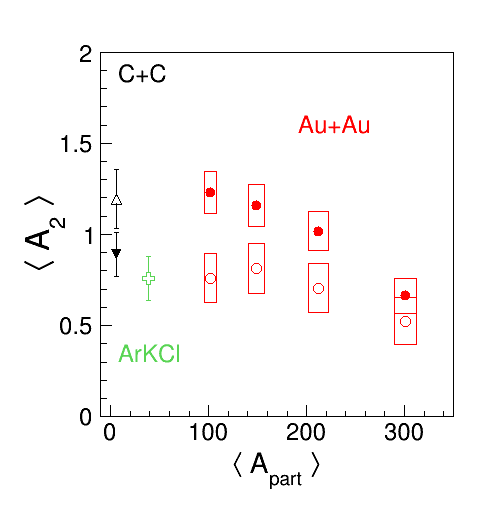 Fig 14. Re-size plots and also correct line colors.
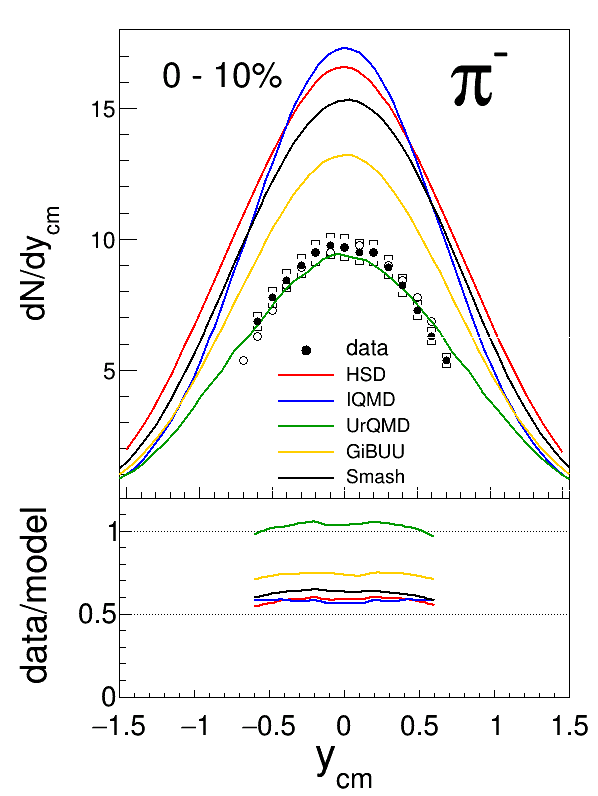
- Fig.15b: add the first point.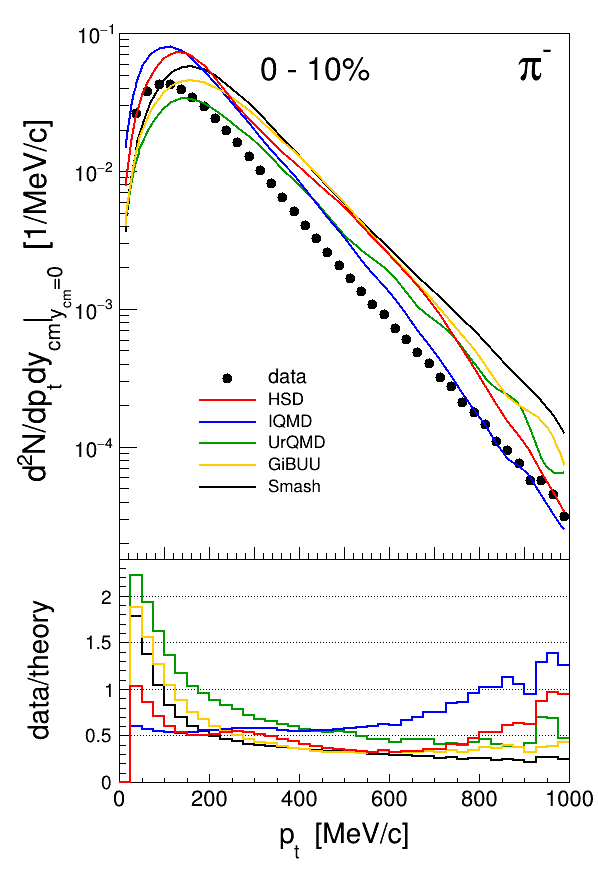
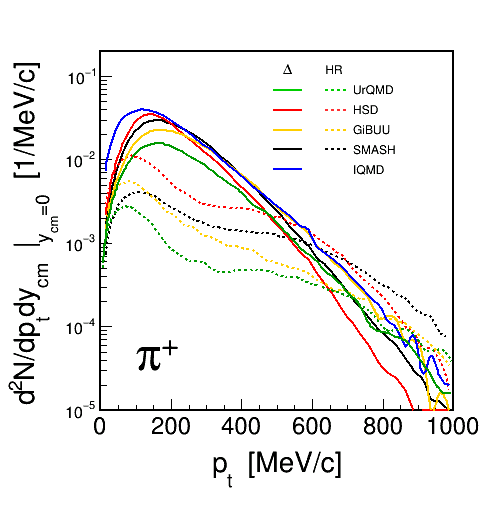
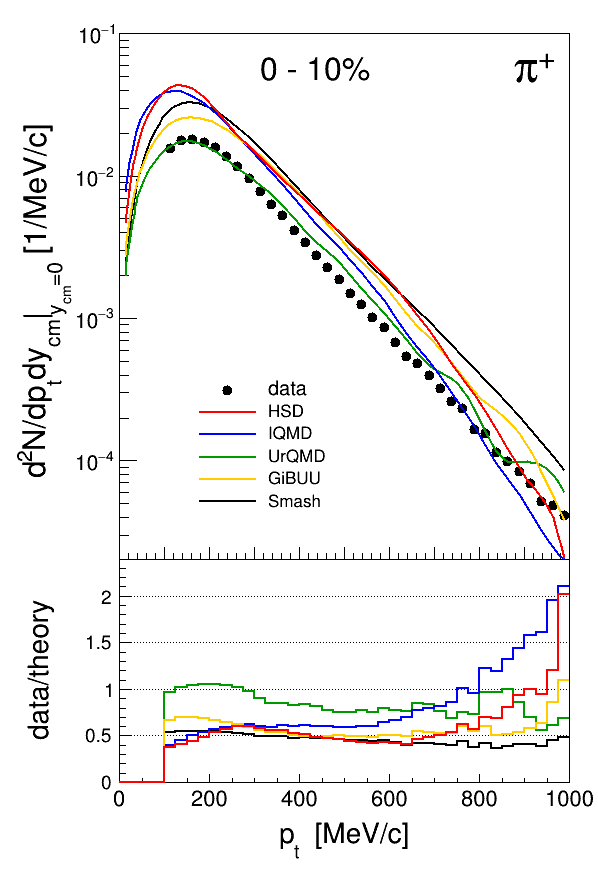 - Fig.16: If not too much work, I like to check wether dn/dpt looks
better. I will re-do this plot in pt, what for mid-rapidity is the same as p_cm. And then it will be in the same as other plots in that chapter where we compare to data.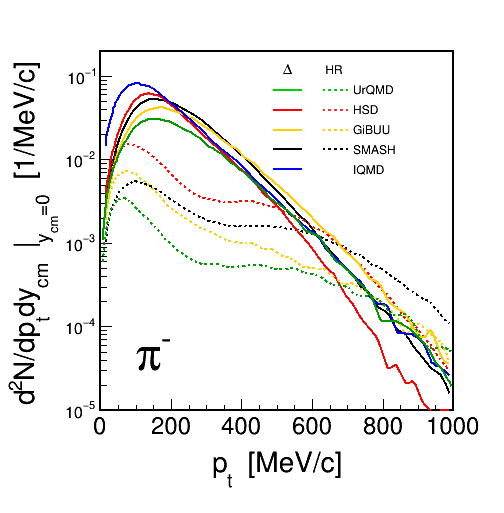
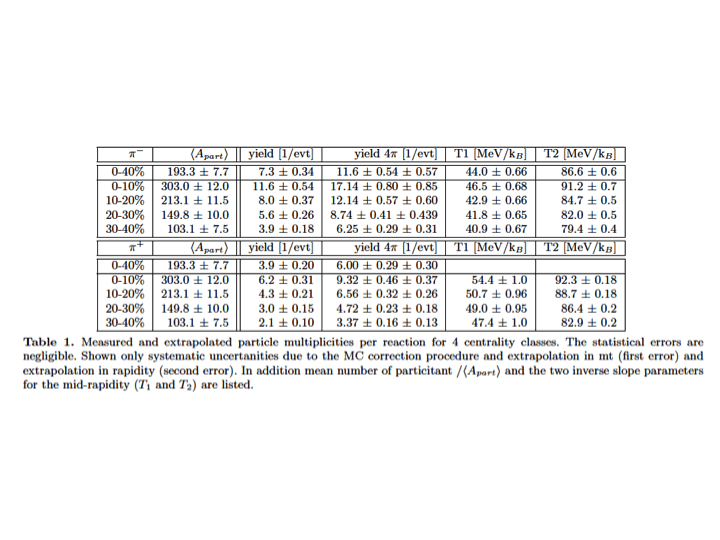
 In attachment below you can find also txt file with content of the Table1 which is displayed below.
 *
*

 Fig.4 - still missing data points (pi+, target-like rapidity)
- rapidity window should be shown in y_cm, not y_lab

 - Fig. 7 needs units on the abscissa of the left panel (Ebeam). (Note suppressed zero on the ordinate.)
 - Fig.8: I propose to remove the N+N point. It is not a HADES
 measurement and should be close to the C+C point. It would raise many
questions which, however, have no impact on the paper content.
If you disagree, leave it as is and we discuss it next week. DONE

- Fig.9 Please change the range of the pt axis to 0- 800 MV/c . Also for pi+ open symbols were added. DONE
 -Fig10. I changed y_axis on left side and also for pi+ made open symbols to be consistent with other plots.
 - Fig.11 c,d: I proposed to have the corresponding pcm distributions
 here. If you prefer not to have them, do nothing. I do not see need for this plot in that chapter, since all plots are integrated over rapidity.
- Fig.13: please put <A2> on the ordinate and make pi+ open symbols and
pi- closed symbols as for C+C. Proper label to that plot : Mean anisotropy parameter <A_2> as a function of the mean number of participants <A_part>. Circles represent experimental Au+Au data (open: pi+, closed pi-). Also shown are earlier HADES results on <A2> average on pi+ and pi- for C+C at 1AGeV (closed triangle) and 2AGeV(open triangle) as well as Ar+KCl at 1.75AGeV (open cross).
 Fig 14. Re-size plots and also correct line colors.


- Fig.15b: add the first point.

 - Fig.16: If not too much work, I like to check wether dn/dpt looks
 better. I will re-do this plot in pt, what for mid-rapidity is the same as p_cm. And then it will be in the same as other plots in that chapter where we compare to data.

 In attachment below you can find also txt file with content of the Table1 which is displayed below.
 *
* | I | Attachment | Action | Size | Date | Who | Comment |
|---|---|---|---|---|---|---|
| |
Fgi13.gif | manage | 6 K | 2019-10-14 - 10:54 | GosiaSudol | |
| |
Fgi15_pip.gif | manage | 17 K | 2019-10-14 - 13:23 | GosiaSudol | |
| |
Fig10.gif | manage | 11 K | 2019-10-17 - 10:32 | GosiaSudol | |
| |
Fig10.pdf | manage | 18 K | 2019-10-17 - 10:32 | GosiaSudol | |
| |
Fig13.pdf | manage | 13 K | 2019-10-14 - 10:54 | GosiaSudol | |
| |
Fig14_pim.gif | manage | 15 K | 2019-10-14 - 21:14 | GosiaSudol | |
| |
Fig14_pim.pdf | manage | 21 K | 2019-10-14 - 21:14 | GosiaSudol | |
| |
Fig14_pip.gif | manage | 14 K | 2019-10-14 - 21:14 | GosiaSudol | |
| |
Fig14_pip.pdf | manage | 20 K | 2019-10-14 - 21:16 | GosiaSudol | |
| |
Fig15_pim.gif | manage | 17 K | 2019-10-14 - 13:23 | GosiaSudol | |
| |
Fig15_pim.pdf | manage | 19 K | 2019-10-14 - 13:23 | GosiaSudol | |
| |
Fig15_pip.pdf | manage | 19 K | 2019-10-14 - 13:23 | GosiaSudol | |
| |
Fig16_pim.gif | manage | 10 K | 2019-10-20 - 23:02 | GosiaSudol | |
| |
Fig16_pim.pdf | manage | 20 K | 2019-10-20 - 23:02 | GosiaSudol | |
| |
Fig16_pip.gif | manage | 10 K | 2019-10-20 - 23:03 | GosiaSudol | |
| |
Fig16_pip.pdf | manage | 20 K | 2019-10-20 - 23:02 | GosiaSudol | |
| |
Fig2_pim.gif | manage | 18 K | 2019-10-14 - 09:31 | GosiaSudol | |
| |
Fig2_pim.pdf | manage | 511 K | 2019-10-14 - 09:30 | GosiaSudol | |
| |
Fig2_pip.gif | manage | 18 K | 2019-10-14 - 09:31 | GosiaSudol | |
| |
Fig2_pip.pdf | manage | 511 K | 2019-10-14 - 09:29 | GosiaSudol | |
| |
Fig4_pim.gif | manage | 17 K | 2019-10-14 - 11:51 | GosiaSudol | |
| |
Fig4_pim.pdf | manage | 34 K | 2019-10-14 - 11:52 | GosiaSudol | |
| |
Fig4_pip.pdf | manage | 33 K | 2019-10-14 - 11:52 | GosiaSudol | |
| |
Fig4_pip_new.gif | manage | 16 K | 2019-10-14 - 11:54 | GosiaSudol | |
| |
Fig7_left.gif | manage | 6 K | 2019-10-14 - 10:10 | GosiaSudol | |
| |
Fig7_left.pdf | manage | 17 K | 2019-10-14 - 10:10 | GosiaSudol | |
| |
Fig7_right.gif | manage | 5 K | 2019-10-14 - 10:14 | GosiaSudol | |
| |
Fig7_right.pdf | manage | 14 K | 2019-10-14 - 10:13 | GosiaSudol | |
| |
Fig8.gif | manage | 4 K | 2019-10-03 - 17:39 | GosiaSudol | |
| |
Fig8.pdf | manage | 13 K | 2019-10-03 - 17:39 | GosiaSudol | |
| |
Fig9.pdf | manage | 15 K | 2019-10-17 - 09:39 | GosiaSudol | |
| |
Fig9_new.gif | manage | 4 K | 2019-10-17 - 09:40 | GosiaSudol | |
| |
Table1.gif | manage | 59 K | 2019-10-20 - 20:34 | GosiaSudol | |
| |
Table1.txt | manage | 2 K | 2019-10-20 - 20:35 | GosiaSudol |
Edit | Attach | Print version | History: r11 < r10 < r9 < r8 | Backlinks | View wiki text | Edit wiki text | More topic actions
Topic revision: r11 - 2019-10-22, GosiaSudol
Copyright © by the contributing authors. All material on this collaboration platform is the property of the contributing authors.
Ideas, requests, problems regarding Foswiki Send feedback | Imprint | Privacy Policy (in German)
Ideas, requests, problems regarding Foswiki Send feedback | Imprint | Privacy Policy (in German)


